Business analytics is a powerful field that combines data analysis, statistical methods, and business knowledge to extract meaningful insights from data and drive informed decision-making.
By mastering business analytics, you can unlock valuable skills applicable across various industries, from marketing and finance to operations and human resources.
Whether you’re aiming to improve customer experiences, optimize business processes, or identify new market opportunities, a strong foundation in business analytics can empower you to make data-driven decisions that propel success.
Finding the perfect business analytics course can be overwhelming, with numerous options available online.
You’re looking for a comprehensive program that covers essential concepts, provides hands-on experience, and is taught by industry experts.
You want a course that not only equips you with theoretical knowledge but also prepares you to tackle real-world business challenges with confidence.
For the best business analytics course overall, we recommend the Business Analytics Specialization offered by Coursera.
Developed by the prestigious Wharton School of the University of Pennsylvania, this specialization provides a comprehensive and engaging learning experience, covering key areas such as customer analytics, operations analytics, people analytics, and accounting analytics.
The capstone project allows you to apply your skills to real-world business problems, solidifying your understanding and showcasing your expertise.
While the Business Analytics Specialization is our top pick, there are other excellent courses available that cater to specific needs and learning preferences.
Keep reading to discover our curated list of recommendations, covering various platforms, specializations, and skill levels, ensuring you find the perfect course to embark on your business analytics journey.
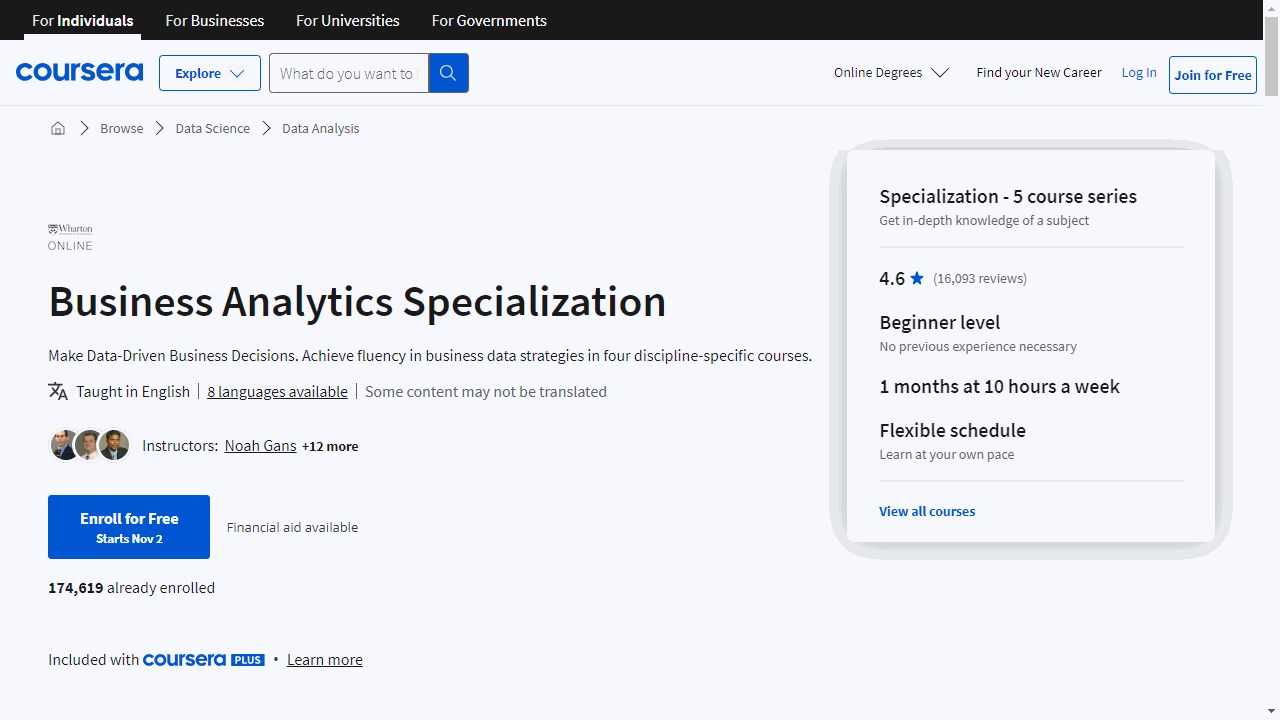
Business Analytics Specialization
Provider: Coursera
The Business Analytics Specialization on Coursera gives you a solid understanding of using data to make better business decisions.
You will learn from Wharton professors and see real-world examples from successful companies.
The specialization begins with “Customer Analytics.”
This course teaches you how to collect and use customer data to make informed business decisions, predict customer behavior, and influence purchasing choices.
You will explore topics like decision trees and simulations while learning from the successes of companies like Amazon and Starbucks.
Next, “Operations Analytics” teaches you how to use data to improve efficiency and make better decisions about supply and demand.
You will learn how to model future demand and use software to solve complex business problems.
Then, you’ll dive into the world of “People Analytics.”
This course explores how to use data for talent management, including recruiting, retaining, and developing top talent.
You will learn cutting-edge techniques used by leading companies like Google.
“Accounting Analytics” demonstrates how to combine financial and non-financial data to improve business decisions.
You will discover how to forecast financial scenarios, manage risk, and understand how key financial and non-financial indicators interact.
Finally, the “Business Analytics Capstone Project” allows you to apply your skills to real-world challenges faced by companies like Yahoo, Google, and Facebook.
You will learn how to optimize marketing, maximize revenue, and make efficient business decisions.
SQL - MySQL for Data Analytics and Business Intelligence
Provider: Udemy
This course provides a comprehensive understanding of SQL and MySQL, essential tools for anyone working with data.
You’ll begin with the fundamentals of databases, understanding how information is structured through records, fields, and tables.
The course then introduces you to SQL, a powerful language for interacting with databases, and MySQL, a popular database management system.
You’ll quickly move from theory to practice, installing MySQL and MySQL Workbench on your computer.
You’ll discover how to create your own databases and tables, defining their structure using SQL’s Data Definition Language (DDL).
You’ll learn how to define different types of data, like strings for text and integers for numbers, and enforce data integrity with constraints like primary keys and foreign keys.
The heart of the course is mastering the SQL SELECT statement, your key to retrieving and analyzing data.
You’ll learn to filter data with WHERE clauses, combine conditions using AND/OR operators, and search for patterns with LIKE/NOT LIKE.
You’ll delve into aggregate functions like COUNT and SUM, powerful tools for summarizing data, and learn to group and order your results for better analysis.
You’ll even master JOINs, a powerful feature for combining data from multiple tables.
The course also covers more advanced techniques like subqueries, views, stored procedures, and even how to integrate your SQL skills with Tableau for creating insightful data visualizations.
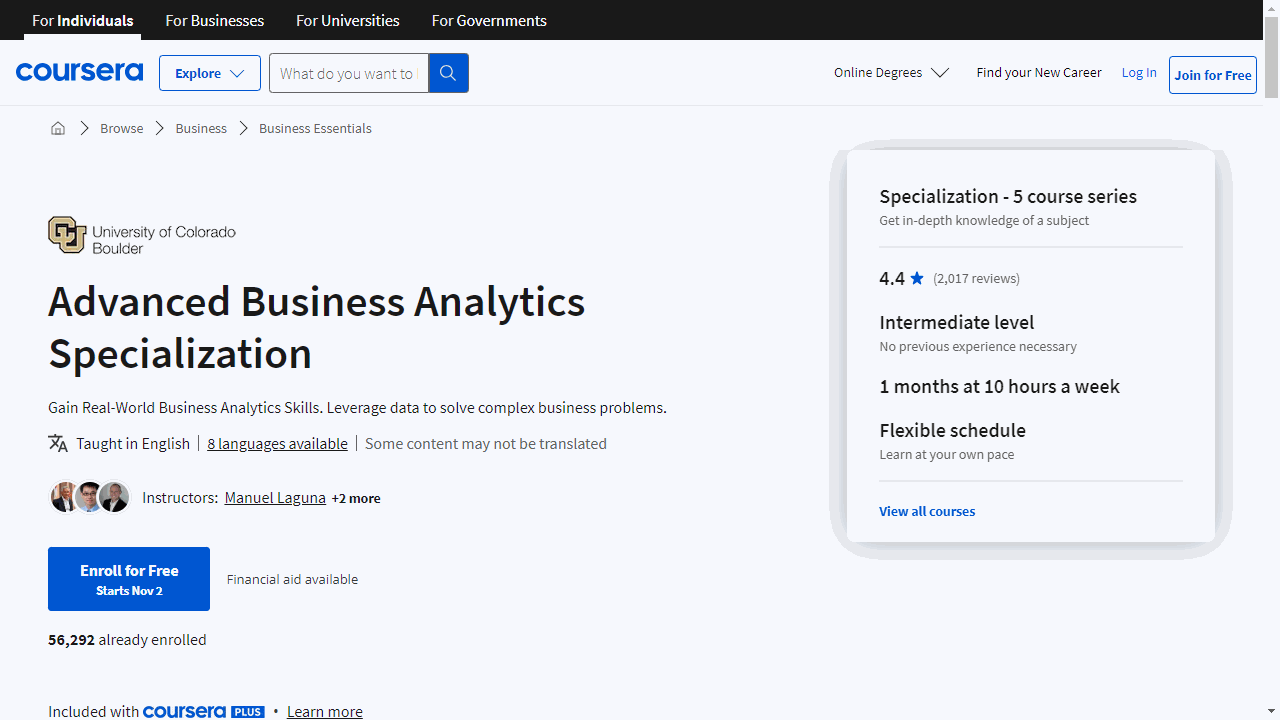
Advanced Business Analytics Specialization
Provider: Coursera
You start by building a strong foundation in data analytics, exploring how data is generated, stored, and accessed in the business world.
You learn about relational databases and practice using SQL to extract valuable data.
You then dive into predictive modeling, discovering techniques like regression analysis to forecast future trends.
You gain proficiency in exploratory data analysis, which is crucial for preparing your data, and learn how to effectively visualize your findings using tools like XLMiner, a popular Excel add-in.
The specialization then guides you through creating models for strategic decision-making.
You explore cluster analysis for market segmentation, delve into Monte Carlo simulation to model uncertainty in business decisions, and master optimization techniques to find the best solutions.
You will use the Analytic Solver Platform to make complex analysis manageable, even without advanced coding skills.
You also discover the importance of communicating your findings clearly.
You learn how to present your insights in a way that everyone understands, even those unfamiliar with analytics.
You master different communication methods, including data visualization techniques, and develop compelling data-driven narratives.
Finally, you apply everything you’ve learned in a capstone project.
You analyze financial loan data for an investment company, tackling a typical data analytics project from data cleaning and analysis to presenting your findings.
This practical experience solidifies your understanding of the entire process.
Microsoft Excel: Business Intelligence w/ Power Query & DAX
Provider: Udemy
This course equips you with the skills to become proficient in business intelligence using Microsoft Excel.
You begin by grasping the “Power Excel” workflow, leveraging tools like Power Query, Power Pivot, and DAX.
These tools will empower you to handle massive datasets, blend data from multiple sources like PDFs and MySQL databases, and create insightful calculated fields.
You will learn to connect, transform, and prepare raw data for analysis using Power Query and its intuitive Query Editor, where you can perform text manipulation, date and time calculations, and even build dynamic rolling calendars.
The course then guides you through the process of building robust data models, emphasizing the importance of database normalization for structured data organization.
You will learn to establish relationships between tables within Excel’s Data Model, ensuring data consistency, and understand how filter context flows through these relationships, impacting data analysis.
This knowledge forms the foundation for accurate and insightful data modeling.
Finally, you will explore the power of DAX, a formula language that enables you to create calculated fields and derive deeper insights from your data.
You will understand the distinction between calculated columns and measures and learn how to leverage DAX functions like CALCULATE, FILTER, ALL, and RELATED to perform sophisticated calculations.
The course covers a range of DAX functions, including math and statistical functions, logical functions, text functions, filter functions, and date and time functions, enabling you to create intricate formulas.
You will also learn about iterator functions like SUMX and RANKX and explore time intelligence formulas, empowering you to analyze performance trends over time.
Strategic Business Analytics Specialization
Provider: Coursera
This Coursera specialization equips you with the tools to make data-driven decisions in various business settings.
You will learn to use analytics to approach business problems by qualifying the issues in quantitative terms, conducting data analyses using techniques like regression and clustering, and presenting findings in a compelling, actionable way.
The program emphasizes hands-on learning with the R programming language and R Studio.
You start with the “Foundations of Strategic Business Analytics,” learning fundamental data analysis concepts.
This prepares you to apply techniques to marketing, supply chain management, and HR.
You then delve deeper into “Foundations of Marketing Analytics,” focusing on understanding customers and refining marketing strategies with market segmentation, customer lifetime value, and targeted marketing techniques like text mining and social network analysis.
“Case Studies in Business Analytics with Accenture” bridges the gap between theory and practice.
Senior practitioners from Accenture provide real-world examples of analytics across industries, offering insights into potential applications.
This prepares you for the specialization’s Capstone Project.
The Capstone Project lets you apply your learned skills to a real-world problem using open data.
You identify a problem within sectors like farming, healthcare, or economics, analyze provided data, and present your findings.
This project allows you to showcase your expertise in strategic business analytics, preparing you for a successful career in the field.
Statistics for Business Analytics and Data Science A-Z™
Provider: Udemy
This course equips you with the statistical foundation for a career in business analytics and data science.
You will start by exploring distributions, learning the difference between continuous and discrete data.
You will understand key concepts like mean, median, mode, and standard deviation.
The course clarifies the often-misunderstood concept of skewness and provides a solid understanding of the normal distribution.
You will then move on to the Central Limit Theorem (CLT), a cornerstone of statistics.
The course explains the relationship between populations and samples, illustrating how the CLT allows you to make inferences about a population based on sample data.
You’ll learn about the sampling distribution and master the Z-score, an essential tool for data analysis.
You’ll even apply the CLT to real-world problems with a hands-on analytics challenge.
Next, you will delve into the world of hypothesis testing, learning to interpret p-values and to determine the validity of your findings.
The course guides you through the steps of hypothesis testing, from defining the null hypothesis to interpreting the results.
You will explore different types of hypothesis tests, including proportion tests and t-tests.
You will understand the assumptions behind each test and learn how to choose the right test for your data.
The course also covers advanced topics such as the Student’s t-distribution and the difference between one-tailed and two-tailed tests.
Finally, you will learn about the potential pitfalls of hypothesis testing, such as the misuse and overuse of p-values.
The course emphasizes best practices for data analysis, ensuring you can confidently apply your knowledge to real-world business problems.
SAS Visual Business Analytics Professional Certificate
Provider: Coursera
This SAS Visual Business Analytics Professional Certificate on Coursera equips you with in-demand data analysis and reporting skills using the powerful SAS platform.
You will begin by mastering the fundamentals of SAS Visual Analytics, familiarizing yourself with the SAS Viya platform and learning how to prepare data using SAS Data Studio.
You will then delve into data analysis and reporting, discovering how to modify data, unearth insights through data discovery, and build interactive reports to showcase your findings.
You will then gain expertise in geographic mapping and forecasting, learning to restructure data for geographic analysis and creating insightful maps and forecasts.
The program then guides you through performing network, path, and text analysis.
You will develop practical skills in creating these analyses within SAS Visual Analytics, empowering you to understand relationships, frequent pathways, and patterns within unstructured text data.
Finally, you will master the art of creating advanced reports, incorporating filters, parameters, and calculated items to develop dynamic and insightful reports that can inform key business decisions.
Advanced SQL: MySQL for Ecommerce & Web Analytics
Provider: Udemy
This course teaches you how to use SQL to understand your customers better and make smarter business decisions.
You’ll learn by doing, using a realistic ecommerce dataset called the Maven Fuzzy Factory database.
This hands-on experience helps you see how the skills you’re learning apply to real-world situations.
You’ll start by setting up MySQL, the program you’ll use to analyze the data, on your computer.
Once you’re set up, you’ll dive into analyzing website traffic.
You’ll learn how to find your top traffic sources, see how many visitors are turning into customers, and even figure out which marketing campaigns are bringing in the most valuable customers.
The course then moves on to website performance.
You’ll discover which pages on your website are the most popular, how to reduce the number of people leaving your website too quickly, and how to use A/B testing to improve your website design.
You’ll also learn how to analyze your different marketing channels, figure out which ones are performing best, and make sure you’re getting the most out of your marketing budget.
You’ll even explore how to analyze product sales, understand customer buying patterns, and identify opportunities for cross-selling.
Also check our posts on:
