Business intelligence (BI) empowers organizations to transform raw data into actionable insights, driving informed decision-making and strategic advantages.
BI professionals are in high demand across industries, playing a crucial role in optimizing operations, identifying market trends, and improving overall efficiency.
By learning BI, you’ll gain valuable skills in data analysis, visualization, and reporting, opening doors to a wide range of career opportunities.
Finding the ideal business intelligence course can be challenging, given the abundance of options available.
You’re searching for a program that not only covers the fundamental concepts but also provides practical experience and aligns with your learning style and career goals.
It’s essential to choose a course that equips you with the tools and knowledge needed to excel in this dynamic field.
For the best business intelligence course overall, we recommend the Google Business Intelligence Professional Certificate on Coursera.
This comprehensive program, developed by Google, offers a structured learning path covering data modeling, pipelines, dashboards, and reporting.
Taught by industry experts, it provides hands-on experience with popular BI tools and techniques, making it an excellent choice for both beginners and those seeking to enhance their BI skills.
While the Google Business Intelligence Professional Certificate stands out as our top pick, there are other excellent courses available catering to various needs and preferences.
Whether you’re interested in specific BI tools, platforms, or industry applications, we’ve compiled a list of recommendations to help you find the perfect fit.
Continue reading to explore these options and embark on your BI learning journey.
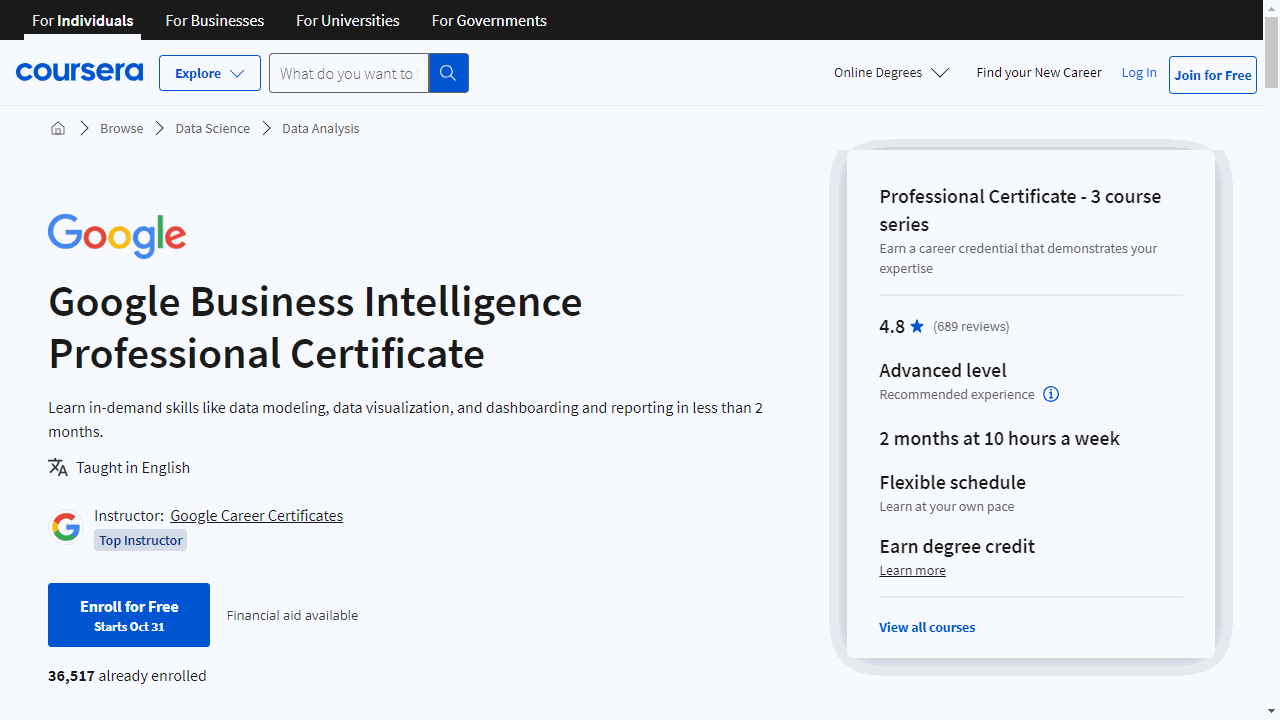
Google Business Intelligence Professional Certificate
Provider: Coursera
This Google Business Intelligence Professional Certificate is perfect if you want to start a career in business intelligence.
The certificate is divided into three courses.
The first course, “Foundations of Business Intelligence,” teaches you the basics of BI, like how BI professionals work within organizations and what BI tools they use.
You will learn the difference between business intelligence and data analysis, discover how data influences decision-making, and get hands-on experience with important BI concepts like data modeling, pipelines, and dashboards.
The second course, “The Path to Insights: Data Models and Pipelines,” teaches you how data is structured and manipulated.
You will learn about different data models, how they are designed, and how to use ETL (extract, transform, load) processes to prepare data for analysis.
This course uses Google Dataflow and BigQuery, two popular tools used for data management and transformation.
The third course, “Decisions, Decisions: Dashboards and Reports,” teaches you how to communicate your insights.
You will learn how to create compelling visualizations and build dashboards using tools like Tableau Software.
This course also teaches you how to present your findings to stakeholders and prepare for job interviews.
This entire program assumes you already understand data analytics, which you can learn through the Google Data Analytics Certificate.
The Business Intelligence Analyst Course 2024
Provider: Udemy
This Business Intelligence Analyst course takes you on a journey to becoming a data-savvy professional.
You begin with a strong understanding of statistics, starting with descriptive statistics.
You’ll learn how to calculate and interpret key measures like mean, median, mode, and standard deviation, essential for understanding data patterns.
The course then dives into inferential statistics, teaching you how to use techniques like hypothesis testing and confidence intervals to draw meaningful conclusions from data, a crucial skill for any analyst.
You’ll then explore the world of databases and learn to communicate with them using SQL.
You’ll gain hands-on experience with MySQL, a popular database management system, and master key SQL concepts like JOINs for combining data from multiple tables and subqueries for more complex data retrievals.
You’ll become comfortable writing efficient SQL queries to extract and manipulate data, a highly sought-after skill in the business intelligence world.
Next, the course introduces you to Tableau, the go-to tool for creating compelling data visualizations.
You’ll learn to transform raw data into insightful charts and interactive dashboards, making your findings easy to understand and act upon.
You’ll master the art of connecting to data sources, building various chart types, and applying filters to focus on specific insights, ultimately enabling you to tell compelling stories with data.
The course also dives into the world of programming with Python, a versatile language widely used in data analysis and beyond.
You’ll learn fundamental Python concepts like variables, data types, and operators, laying the groundwork for writing your own code.
You’ll explore Python libraries like pandas and numpy, powerful tools for data manipulation and analysis.
You’ll also delve into data visualization with libraries like matplotlib and seaborn, learning how to create insightful plots and graphs from your data.
This course culminates in a practical project that simulates a real-world business scenario.
You’ll integrate your SQL and Python skills by analyzing a dataset related to absenteeism at work, drawing insights, and creating visualizations in Tableau to present your findings.
This hands-on project solidifies your understanding and equips you with the practical skills to tackle real-world business challenges.
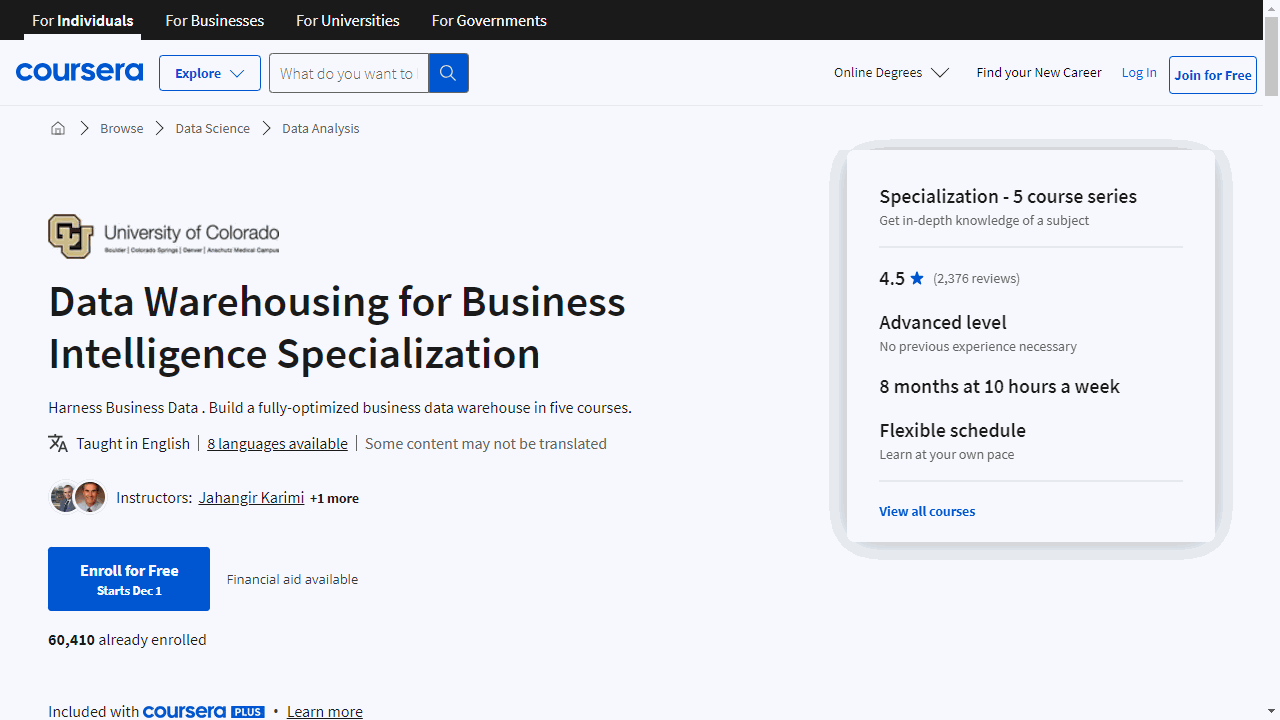
Data Warehousing for Business Intelligence Specialization
Provider: Coursera
This specialization on Coursera equips you with the essential skills to design, build, and manage data warehouses for business reporting and analysis.
You start by building a strong foundation in relational databases and SQL, using popular database management systems like Oracle, MySQL, or PostgreSQL.
You learn to create ERDs using tools like ER Assistant or Visual Paradigm, ensuring efficient and effective database designs.
You then dive into data warehouse design, learning about data warehouse maturity models, architectures, and multidimensional models.
You gain practical experience using open-source tools like Pentaho for data integration, manipulating pivot tables, and integrating data from various sources.
This knowledge helps you build data warehouses that satisfy the needs of any organization.
Next, you explore advanced SQL techniques for business data analysis, delving into different storage architectures and understanding the impact of big data on data warehouse development.
This expertise makes you a well-rounded data professional capable of managing complex data warehouse deployments.
You then learn how to use data warehouses for business intelligence, gaining hands-on experience with the powerful business intelligence platform MicroStrategy.
You discover how to create interactive dashboards and visualizations, equipping you to leverage data warehouses for data-driven decision-making.
Finally, you apply your knowledge in a real-world case study.
You design and build a small data warehouse, create data integration workflows, write SQL queries, and build dashboards and visualizations using MicroStrategy.
This capstone project provides practical experience and a portfolio piece to showcase your skills to potential employers.
Microsoft Power BI Desktop for Business Intelligence
Provider: Udemy
This Microsoft Power BI Desktop for Business Intelligence course guides you through the complete workflow, from importing data to building insightful dashboards.
You start by getting comfortable with the Power BI Desktop interface and learn how to connect to diverse data sources like databases and websites using Power Query Editor.
You also learn how to clean, transform, and prepare your data for analysis, making it ready for creating powerful visualizations.
The course then dives into data modeling, a crucial skill for any aspiring business intelligence analyst.
You discover how to build relationships between different datasets, create fact and dimension tables, and understand the difference between star and snowflake schemas.
You learn about filter context and how to optimize your data models for efficient analysis.
This sets the stage for creating compelling visuals and dashboards later in the course.
You master DAX, the language of Power BI, to create calculated fields and measures for advanced analysis.
You learn about syntax, operators, and different categories of functions like math, stats, logic, text, and date & time.
You’ll get hands-on experience with important DAX functions like CALCULATE and ALL, enabling you to derive deeper insights from your data.
The course also covers time intelligence patterns for analyzing data across different time periods.
Finally, you delve into the visual side of Power BI.
You learn how to design interactive dashboards filled with insightful charts and graphs, going beyond simple bar charts and line graphs to leverage the full spectrum of Power BI visualizations.
You also learn how to use conditional formatting, drill down features, and filters to create dynamic and engaging reports.
The course also introduces you to powerful AI-driven features like Anomaly Detection, Smart Narratives, Q&A Visuals, Decomposition Trees, and Key Influencers, which help uncover hidden patterns and insights within your data.
You can immediately apply your learning in the Maven Market project, where you build a complete business intelligence solution for a fictional company.
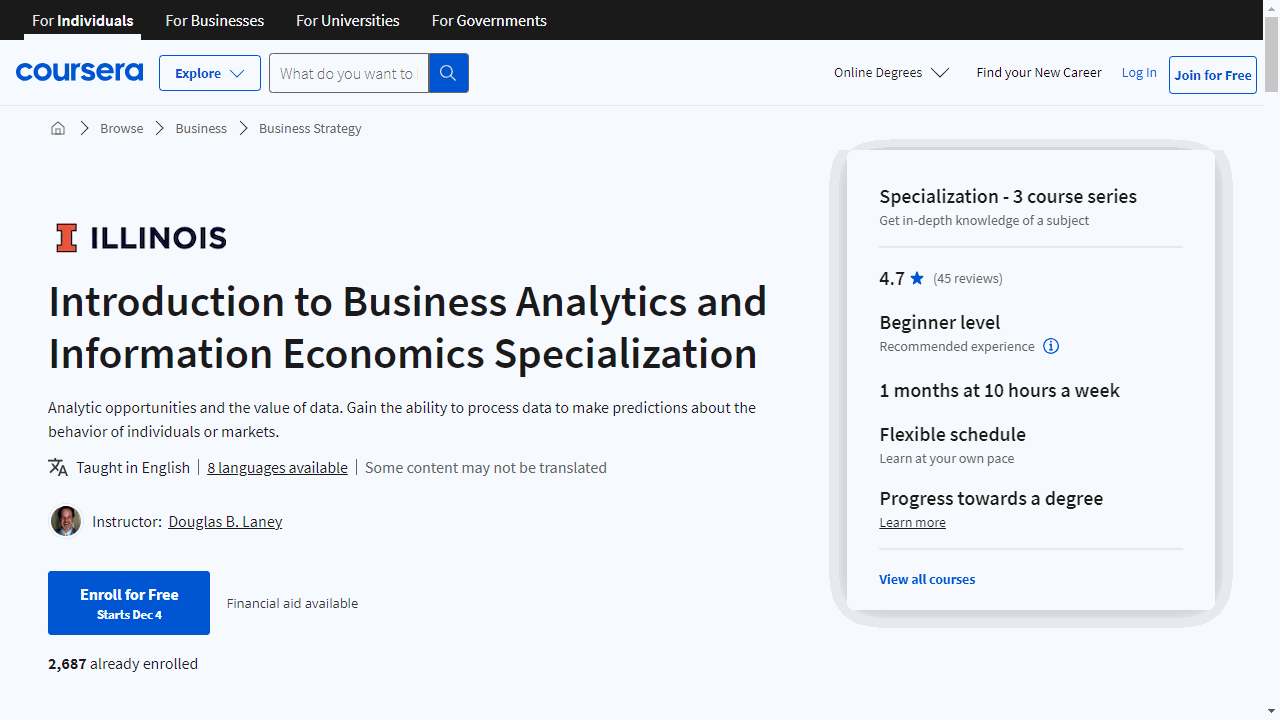
Introduction to Business Analytics and Information Economics Specialization
Provider: Coursera
This specialization on Coursera teaches you how to use data to make better business decisions and how to think about information as a valuable asset, like gold or real estate.
You begin with “Business Analytics Executive Overview,” which introduces you to data analysis and how businesses use it to predict things like customer behavior or market trends.
You’ll explore real-world case studies from different industries and learn about essential technologies like data warehouses, which are like giant digital storage units for information.
The course also introduces you to roles like business intelligence analysts and data scientists, who work with data.
Next, you’ll dive into the fascinating world of “Infonomics” with two dedicated courses.
In “Infonomics I,” you’ll discover how to determine the economic value of data.
You’ll learn how to make money from data and use it to create new income sources for businesses.
Think of it like discovering a gold mine of information and learning how to extract that gold.
“Infonomics II” goes deeper into managing information as a valuable asset, just like managing a stock portfolio.
You’ll explore techniques for measuring data’s worth and making smart choices about investing in data-related projects, like new software or hiring data experts.
Imagine you’re a treasure hunter who has found a map; this course teaches you how to read the map and decide which treasures are worth pursuing.
SQL - MySQL for Data Analytics and Business Intelligence
Provider: Udemy
Whether you’re interested in Business Intelligence, data science, or back-end development, this course provides a solid foundation.
You’ll begin by building a strong understanding of relational databases, including primary and foreign keys, and the relationships between tables.
Using MySQL Workbench, you’ll gain hands-on experience creating databases and tables.
You’ll master the SQL language, learning how to define data structures (DDL), manipulate data (DML), control data access (DCL), and manage transactions (TCL).
You’ll become proficient with SQL keywords like CREATE, ALTER, UPDATE, and DELETE.
You’ll learn to write increasingly sophisticated queries using the SELECT statement, filtering data, sorting results, and grouping data.
The course dives into JOINs, teaching you how to combine data from multiple tables.
You’ll master various JOIN types like INNER JOIN, LEFT JOIN, RIGHT JOIN, and CROSS JOIN.
You’ll then explore advanced SQL topics like subqueries, useful for complex data retrievals, and self-joins, which allow you to compare data within a table.
You’ll learn about views, which simplify complex queries, and stored routines, such as stored procedures and user-defined functions, which automate tasks within the database.
You’ll learn to use window functions like ROW_NUMBER, RANK, and DENSE_RANK, to analyze data within specific partitions.
Finally, the course bridges the gap between SQL and data visualization by demonstrating how to integrate SQL with Tableau.
You’ll learn how to extract data from MySQL and create insightful charts and dashboards in Tableau.
Database Design and Operational Business Intelligence Specialization
Provider: Coursera
This series of courses begins with the fundamentals of database design.
You will discover how to construct Entity Relationship Diagrams (ERDs) and master the art of SQL scripting to create your own databases.
This foundation in SQL will allow you to build and manage databases effectively.
You will also gain a clear understanding of what business intelligence entails and how it sets itself apart from business analytics and data science.
The specialization then guides you through the intricate world of data warehousing.
You will learn how to capture and manipulate data using ETL (Extract, Transform, Load) processes.
You will explore different data warehousing architectures, such as star schema and snowflake schema, and grasp the concept of multidimensional modeling, essential for organizing and analyzing vast amounts of data.
Additionally, you will dive into data mining, a crucial aspect of business intelligence, and learn how to develop both predictive models, like classification and estimation models, and explanatory models, like clustering and association models.
Finally, you will explore the power of data visualization using SAS Viya, a popular cloud-based platform.
You will discover how to transform data into insightful visuals, allowing you to communicate findings effectively.
You will also gain exposure to advanced concepts such as cloud architecture, automation, and machine learning, further enhancing your understanding of how technology can be leveraged for sophisticated data analysis and automation.
Microsoft Excel: Business Intelligence w/ Power Query & DAX
Provider: Udemy
This Microsoft Excel course teaches you how to use Excel for business intelligence, going from beginner to expert in Power Query, Power Pivot, and DAX.
You start by understanding the “Power Excel” workflow, which combines Power Query, Power Pivot, and DAX to analyze large datasets.
You’ll see why these tools are considered revolutionary by experts and learn how they’re used to automate data loading and create powerful calculated fields.
You then learn how to use Power Query to connect to various data sources, like Excel files, PDFs, and MySQL databases, before importing that data into Excel.
You’ll master the Query Editor, where you’ll transform data by cleaning, shaping, and preparing it for analysis.
You’ll learn about table transformations, text and number manipulation, and how to work with dates and times in your data.
Once you understand data transformation, you move on to building table relationships in Excel’s data model, a crucial step for efficient data analysis.
You’ll learn about database normalization, the difference between data and lookup tables, and the advantages of relationships over merged tables.
You’ll discover how to create and manage relationships between different tables, ensuring your data is structured efficiently.
The course then dives into data analysis using Power Pivot and DAX.
You’ll learn how to create “Power” PivotTables that connect to entire data models, allowing for more complex analysis than traditional PivotTables.
You’ll master DAX, a formula language that lets you create custom calculations called “measures.”
You’ll learn about different types of measures, how to use them to gain insights, and how to write DAX formulas using functions like CALCULATE, FILTER, and SUMX.
Also check our posts on:
