Data analytics is the process of examining raw data to draw conclusions about the information it contains.
It’s a multi-faceted field that encompasses several techniques and processes for preparing, cleaning, and processing data to uncover hidden patterns, unknown correlations, market trends, and customer preferences that can help companies make more informed business decisions.
Learning data analytics can open doors to a variety of in-demand careers in various industries.
Data analysts are highly sought after by organizations of all sizes, as they play a crucial role in extracting valuable insights from data and driving data-informed strategies.
Finding the ideal data analytics course can be a daunting task, given the abundance of options available online and offline.
You’re looking for a program that not only covers the fundamental concepts but also provides practical, hands-on experience with industry-standard tools and techniques.
You want a course that will equip you with the skills and knowledge needed to confidently tackle real-world data analysis challenges.
For the best data analytics course overall, we recommend Tableau A-Z: Hands-On Tableau Training for Data Science.
This comprehensive Udemy course provides a deep dive into Tableau, one of the most popular data visualization and analysis tools used by professionals worldwide.
The course covers everything from basic visualizations to advanced techniques, making it an excellent choice for beginners and those looking to enhance their existing skills.
You’ll learn how to connect to various data sources, build interactive dashboards, and communicate your findings effectively through compelling data stories.
However, if you’re looking for something more specific or tailored to a particular learning style, there are plenty of other fantastic data analytics courses available.
Keep reading to explore our recommendations for various learning paths, skill levels, and preferred learning platforms.
Tableau A-Z: Hands-On Tableau Training for Data Science
Provider: Udemy
This course takes you from the ground up, starting with installing Tableau and connecting to data sources like CSV files.
You’ll quickly learn how to build basic visualizations like bar charts, spicing them up with colors, labels, and formatting to make your data pop.
You’ll then dive into powerful tools like time series analysis, where you’ll wrangle data extracts and master the art of aggregation and filtering.
As you progress, you’ll create insightful area charts and unlock the potential of interactive filters for real-time data exploration.
You’ll then connect data like a pro, mastering different types of joins and building impressive dashboards that combine various visualizations for a complete picture.
Get ready to go deeper with advanced data preparation techniques.
You’ll learn how to pivot data, split columns, and even fix those pesky geographical data errors.
You’ll become a Tableau master, using clusters to group similar data points and unlock powerful modeling techniques.
Finally, the course introduces you to the latest and greatest Tableau features.
You’ll learn to work with data from unexpected sources like PDF files and connect to spatial data for insightful geographical visualizations.
You’ll also master cutting-edge techniques like step and jump line charts and viz-in-tooltips, taking your visualizations to a whole new level.
Data Analyst Nanodegree
Provider: Udacity
The Udacity Data Analyst Nanodegree equips you with the skills to become a data expert.
You will learn to use industry-standard tools like Pandas and NumPy to clean and organize messy data, revealing hidden patterns and insights.
You will go beyond basic analysis by mastering data visualization techniques with Matplotlib and Seaborn, learning to create clear and compelling visuals to share your findings.
The program emphasizes a practical, hands-on approach.
You will gain real-world experience in data wrangling, learning to gather, assess, and clean data from different sources using Python.
You will also delve into machine learning, exploring how to use this powerful tool to make predictions from data.
Taught by experienced data professionals like Josh Magee, Senior Data Scientist at Local Logic, and Ria Cheruvu, AI Software Architect at Intel, the program provides expert guidance and support.
You will even receive career services advice, learning how to optimize your LinkedIn and GitHub profiles to showcase your newfound data skills to potential employers.
Marketing Analytics Nanodegree
Provider: Udacity
This nanodegree equips you with foundational data skills relevant to marketing.
You will learn to collect and analyze data, model marketing scenarios, and communicate your findings.
The program utilizes industry-standard tools like Excel and Tableau, ensuring you gain practical experience.
The curriculum begins by solidifying your understanding of descriptive statistics and spreadsheet proficiency, providing a robust base for data manipulation and analysis.
You then transition into the realm of data visualization, mastering the art of conveying insights through compelling visuals using Tableau.
This module emphasizes storytelling with data, a crucial skill for impactful communication.
The program delves into marketing-specific techniques, equipping you to analyze marketing data, craft insightful analytical briefs, and build data-driven strategic proposals.
You will develop a deep understanding of key marketing metrics and learn to leverage them for informed decision-making.
Imagine analyzing a company’s marketing data to understand customer behavior or crafting a data-driven proposal to optimize marketing campaigns.
Finally, the nanodegree provides career guidance, helping you navigate the job market effectively.
You will learn industry research techniques and acquire the skills to enhance your LinkedIn profile, boosting your visibility to potential employers.
This holistic approach ensures you graduate not just with in-demand skills but also with the tools and knowledge to market yourself effectively in the competitive job market.
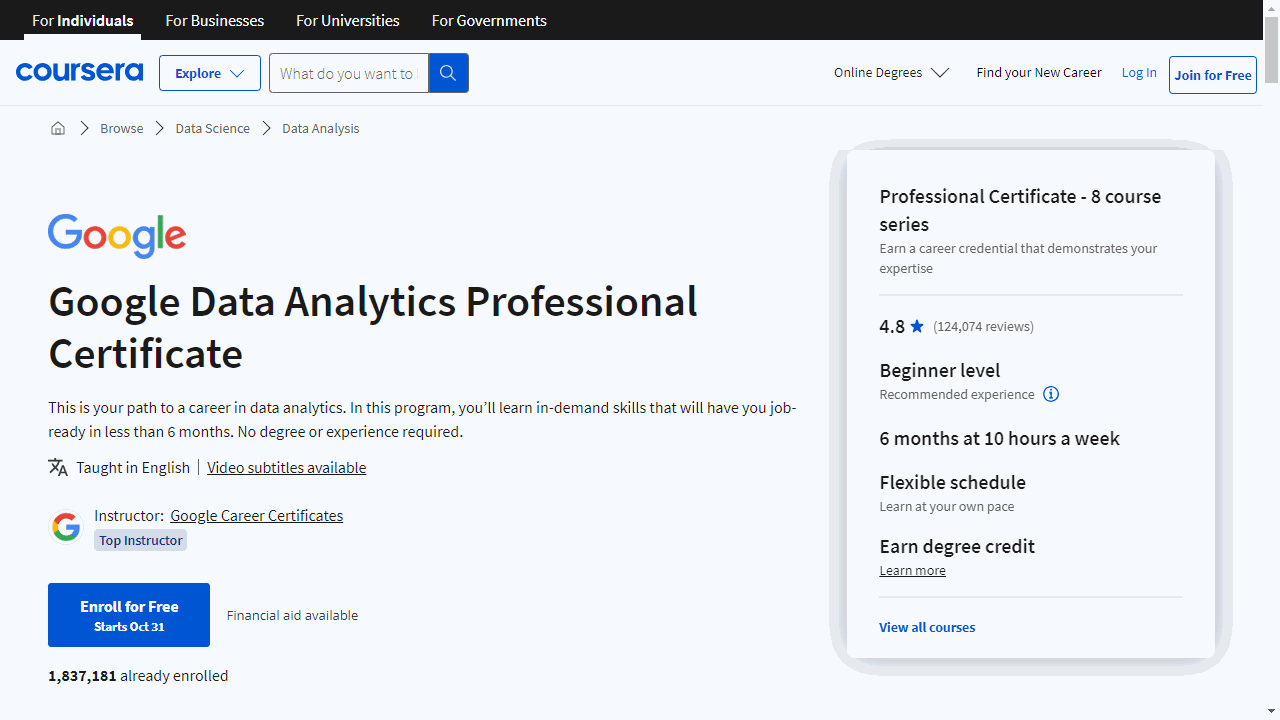
Google Data Analytics Professional Certificate
Provider: Coursera
The Google Data Analytics Professional Certificate on Coursera is a great option if you want to learn the skills needed for entry-level data analyst jobs.
This eight-course program teaches you everything from the basics of data analysis to more advanced techniques, even if you have no prior experience.
You will start with the fundamentals, learning about the data life cycle, analytical thinking, and tools like spreadsheets and SQL.
You will then discover how to ask effective questions to guide your analysis, make data-driven decisions, and communicate your findings to stakeholders.
As you progress, you will explore data collection, data types, and how to identify bias in data, ensuring data credibility for your analysis.
You will then dive into data cleaning techniques using spreadsheets and SQL, learning how to check for data integrity and present your data cleaning results.
This foundation will be crucial as you move into organizing and formatting data to answer specific business questions, performing calculations using formulas, functions, and SQL queries.
The program then explores the art of data visualization, teaching you how to use tools like Tableau to create visual dashboards and communicate your data findings through compelling data stories.
You will learn R programming, gaining insights into its benefits and applications within RStudio.
You will become familiar with R packages, dataframes, and techniques to generate visualizations.
Finally, you can complete an optional case study to apply your learned skills.
This will allow you to showcase your abilities to potential employers while demonstrating your understanding of the data analysis process.
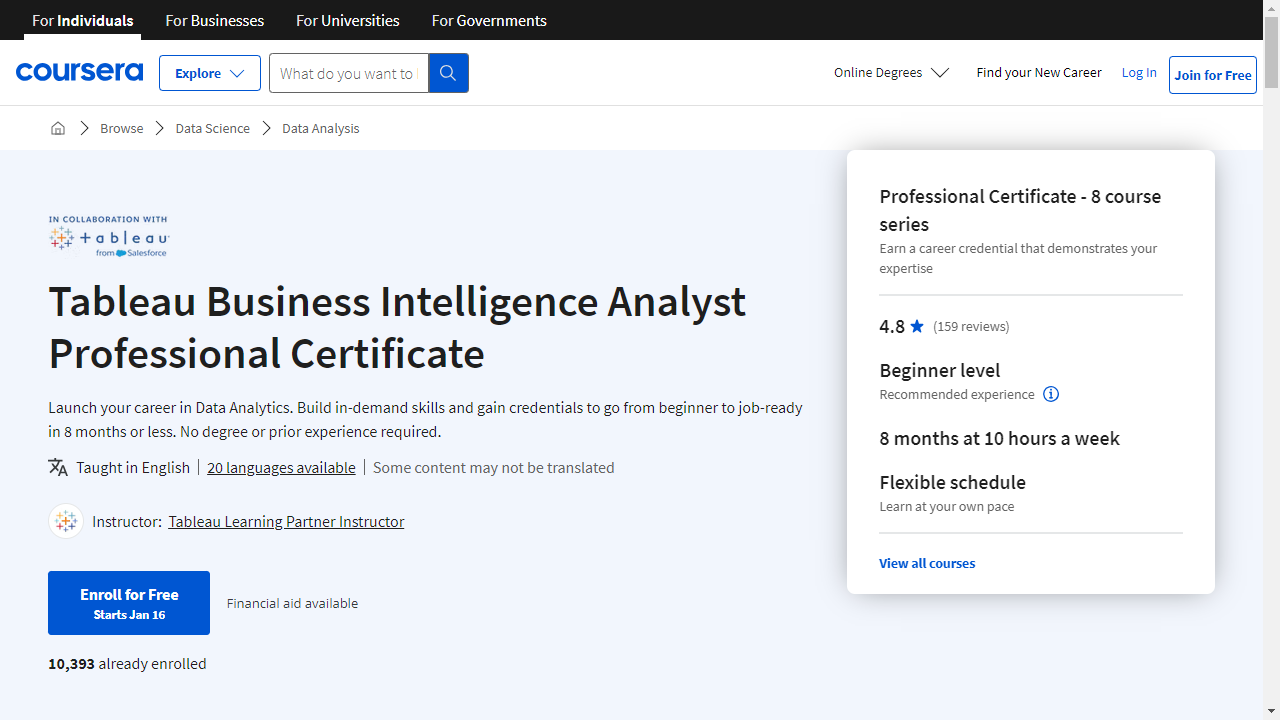
Tableau Business Intelligence Analyst Professional Certificate
Provider: Coursera
This Coursera program equips you with the skills needed to excel as a Business Intelligence Analyst.
You’ll begin by mastering the fundamentals of business analysis and data analytics, including stakeholder identification, business problem definition, and the creation of industry-standard business requirements documents.
The program then delves into the data ecosystem, exploring various data sources, the significance of data quality and governance, and the principles behind modern data architecture.
You’ll then dive into the world of Tableau, learning to create a range of visualizations, from interactive tables and maps to advanced charts like dual-axis and bar-in-bar charts.
This program provides hands-on experience with Tableau Public, a free platform where you can put your newfound data visualization skills into practice.
You’ll discover how to manipulate and prepare data for analysis within Tableau, conduct exploratory data analysis, and generate insightful reports using descriptive statistics and visualizations.
Finally, you’ll learn to communicate your data-driven insights effectively through compelling storytelling techniques.
You’ll master the art of crafting interactive dashboards and impactful presentations, enabling you to share your findings with stakeholders clearly and persuasively, empowering them to make well-informed decisions.
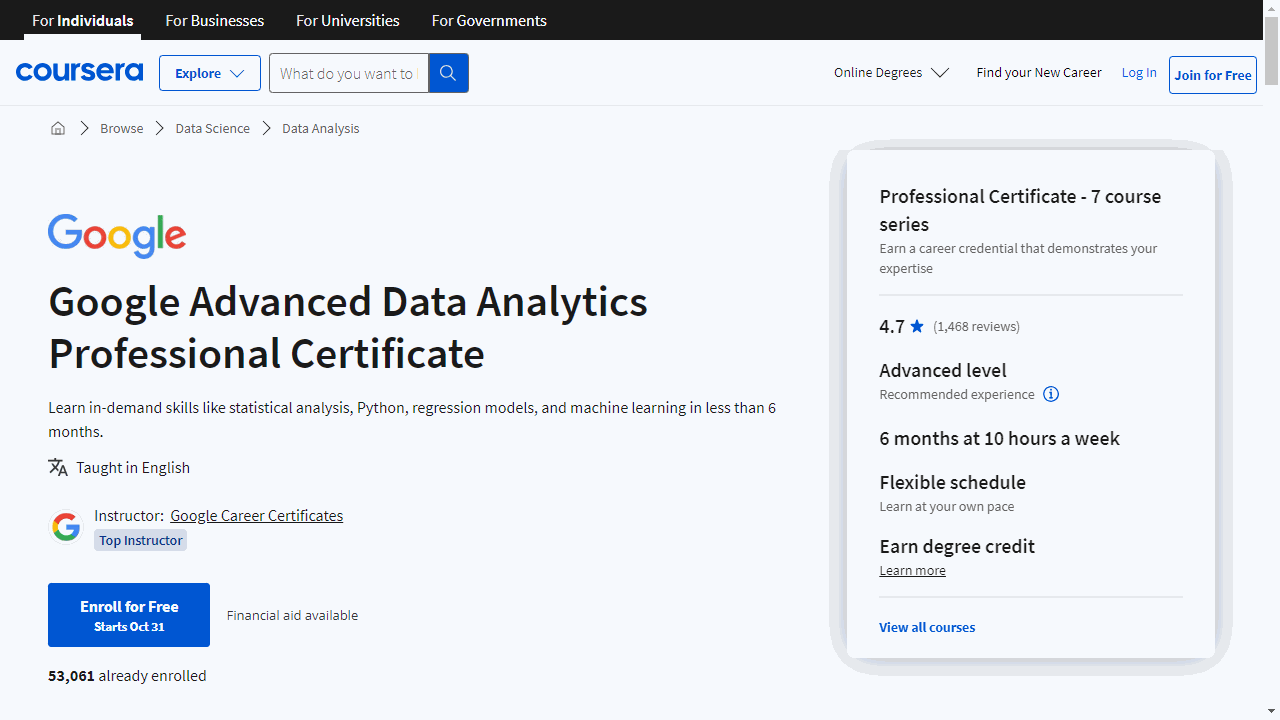
Google Advanced Data Analytics Professional Certificate
Provider: Coursera
The Google Advanced Data Analytics Professional Certificate on Coursera is designed to equip you with the skills needed to excel in data science and advanced data analytics roles.
You will start by building a strong foundation in data science, understanding the role of data professionals, and mastering the PACE project workflow (Plan, Analyze, Construct, Execute) for seamless project management.
The program then guides you through the world of Python programming, a staple for data professionals.
You will learn to wield Python for tasks like data cleaning, manipulation, and analysis.
Alongside Python, you will explore libraries like NumPy and pandas, essential tools for data manipulation.
You will discover the art of data storytelling and learn to translate complex data into compelling narratives, coupled with creating insightful data visualizations using tools like Tableau.
Moving on, you will delve into the world of statistics, gaining a robust understanding of descriptive and inferential statistics.
This will encompass exploring concepts like probability, sampling, confidence intervals, and hypothesis testing, all while using Python for practical application.
The certificate further enhances your skillset by introducing regression analysis, a powerful technique for deciphering relationships between different variables.
You will become comfortable with various regression models, such as linear regression, analysis of variance (ANOVA), and logistic regression.
Finally, you will conquer the fascinating realm of machine learning, understanding both supervised and unsupervised learning.
You will explore and apply popular machine learning models like Naive Bayes, decision tree, random forest, and K-means to tackle real-world business problems.
To culminate your journey, the Google Advanced Data Analytics Capstone project presents a golden opportunity to put your honed skills into action.
You will tackle a real-world project, analyzing data, building models, generating insightful visualizations, and presenting your findings like a seasoned professional.
Statistics for Data Analysis Nanodegree
Provider: Udacity
The “Statistics for Data Analysis” Nanodegree from Udacity provides you with essential skills for data-driven roles, like describing data, understanding probability, designing experiments, and applying statistical models using Python.
You start with descriptive statistics, learning how to summarize data using measures like mean, median, and standard deviation, and understand different data types.
You then dive into probability, exploring concepts like conditional probability and Bayes’ Rule, to understand how probabilities change with new information.
The course then equips you to design experiments, interpret results, and run A/B tests to compare different strategies.
You’ll learn about the normal distribution, sampling distributions, confidence intervals, and hypothesis testing.
Finally, you explore statistical algorithms, including regression, using Python to build models and draw meaningful insights from data.
This Nanodegree culminates in a capstone project where you analyze the results of an A/B test.
You also receive career services, including resume reviews and tips on optimizing your LinkedIn and GitHub profiles.
Power BI A-Z: Hands-On Power BI Training For Data Science!
Provider: Udemy
You’ll begin by installing Power BI and immediately start creating your first bar chart.
The course teaches you how to connect to data, explore it using hierarchies, and add visual elements like colors and labels.
You’ll master the art of drilling down into data hierarchies, allowing you to analyze information with laser focus.
Next, you’ll explore timeseries data, understand aggregation levels, and learn how to use filters and slicers.
These tools are essential for creating dynamic and interactive reports.
You’ll become proficient in designing area charts, scatter plots, and even geographical maps, all while learning the difference between calculated columns and measures.
Imagine being able to visualize data geographically – the insights are powerful!
This course then guides you through building an interactive business intelligence report, culminating in the creation of a customer segmentation dashboard.
You’ll work with real-world datasets, practicing techniques like setting geographical roles and creating table calculations.
The course even covers how to build treemaps, offering a visually compelling way to present hierarchical data.
Finally, you’ll explore the world of custom visuals, learning how to install and utilize them to take your reports to the next level.
Imagine presenting your data with unique and engaging visuals like chord charts!
Beginner’s Guide to Data & Data Analytics, by SF Data School
Provider: Udemy
This Udemy course, “Beginner’s Guide to Data & Data Analytics” by SF Data School, equips you with a fundamental understanding of data and its growing importance.
You’ll discover what data is, where it originates, and how it’s utilized across industries.
The course then guides you through the distinct roles in the data field, differentiating Data Analytics from Data Science and Data Engineering, showcasing how these roles collaborate.
You’ll delve into the “Data Analytics Tool Triangle,” mastering essential tools like spreadsheets, databases, and Business Intelligence (BI) software.
The course explores the role of SQL (a query language) in data analysis and how these tools interact.
You’ll grasp the different types of data, files, and formats, understanding their impact on tool utilization.
The course illuminates Data Pipelines, allowing you to trace the journey of data from collection to analysis, and become proficient in data handling.
You’ll reinforce your understanding of data concepts and terminology through flashcards.
Finally, the course provides a learning roadmap, outlining potential career paths in the data analytics field, setting you on a path to becoming a skilled data professional.
Also check our posts on:


