DAX (Data Analysis Expressions) is a powerful formula language used in Microsoft Power BI and Power Pivot to create calculated fields and perform complex data analysis.
Learning DAX empowers you to unlock hidden insights from your data, build dynamic reports, and make data-driven decisions.
By mastering DAX, you can elevate your business intelligence skills and gain a competitive edge in the field of data analysis.
Finding the right DAX course on Udemy can be a daunting task, with so many options available.
You’re looking for a program that’s comprehensive, engaging, and taught by experts, but also fits your learning style and goals.
You want a course that goes beyond the basics, providing practical experience and hands-on projects to solidify your understanding.
For the best DAX course overall on Udemy, we recommend Microsoft Excel: Business Intelligence w/ Power Query & DAX.
This course combines data modeling, Power Query, and DAX, providing a comprehensive foundation for building powerful business intelligence solutions.
The instructor explains concepts clearly and provides practical examples, making the learning process engaging and effective.
While this is our top pick, we understand that everyone has different learning preferences and needs.
Keep reading to discover other recommended courses, tailored to specific learning levels, areas of focus, and career goals.
Microsoft Excel: Business Intelligence w/ Power Query & DAX
This course teaches you how to use Excel’s powerful data modeling and business intelligence tools to connect, transform, and analyze large datasets.
It starts by introducing the “Power Excel” workflow, which involves using Power Query to connect and transform raw data sources, and then building relationships between tables in Excel’s data model.
You’ll learn how to apply basic table transformations, work with text, number, and date fields, and even create rolling calendars using custom M queries in the Excel Query Editor.
Next, you’ll dive into the principles of database normalization and learn how to structure efficient data models using table relationships instead of merged tables.
The course covers key concepts like cardinality, filter flow, and hiding fields from client tools like PivotTables.
With your data model built, you’ll learn how to analyze your data using Power Pivot and Data Analysis Expressions (DAX).
You’ll discover the differences between calculated columns and measures, and understand how to use DAX formula syntax and operators to create powerful calculated fields.
The course includes demos of key DAX functions for math, logic, text manipulation, and even time intelligence for calculating period-over-period changes or running totals.
Throughout the course, you’ll work with downloadable project files to practice your new skills.
The instructor shares best practices for Power Query, data modeling, and DAX development, and discusses topics like managing query performance and speed.
Finally, the course wraps up with an overview of data visualization options for your Excel data models, including PivotTables, Power View, and even Microsoft Power BI.
Advanced DAX for Microsoft Power BI Desktop
This course starts with a review of prerequisite skills like data modeling and basic DAX.
You’ll then dive into the inner workings of the DAX engines, learning about formula and storage engines, data types, and the VertiPaq columnar data structure.
The course provides tips and best practices for writing efficient DAX code, including shortcuts, formatting guidelines, evaluation order, error handling, and using variables for testing and debugging.
You’ll explore scalar functions for aggregations, rounding, conversions, and logical operations through hands-on assignments.
Advanced CALCULATE is a major focus, covering expanded tables, context transition, evaluation order, and modifiers like REMOVEFILTERS and KEEPFILTERS.
Table and filter functions like DISTINCT, VALUES, ALLEXCEPT, ALLSELECTED, and SUMMARIZE are covered in depth, along with techniques for generating new data tables.
You’ll learn how to perform calculated table joins using CROSSJOIN, UNION, EXCEPT, and INTERSECT.
The course dives into relationship functions like RELATED, RELATEDTABLE, USERELATIONSHIPS, CROSSFILTER, and TREATAS for working with virtual relationships.
Iterator functions are explored, including CONCATENATEX for dynamic labeling, AVERAGEX for moving averages, and RANKX.
Time intelligence is another key topic, covering automatic date tables, date formatting, and functions like PARALLELPERIOD, PREVIOUSQUARTER, and SAMEPERIODLASTYEAR for period-over-period analysis.
The course provides a sneak peek into performance tuning with the Power BI Performance Analyzer and DAX Studio tools.
You’ll learn an optimization workflow to identify and address bottlenecks in your DAX code.
Throughout the course, you’ll work on a real-world project with the Maven Roasters dataset, applying the concepts through practical assignments and quizzes.
Power BI Master Class-Data Models and DAX Formulas
This Power BI Master Class is designed to equip you with the knowledge and skills to transform raw data into insightful reports using the powerful combination of data models and DAX formulas.
You’ll start by diving deep into the fundamentals of building a robust data model, the foundation upon which your reports will stand.
This section covers the essential Power BI Desktop setup and introduces you to the basic building blocks of data modeling.
Next, you’ll learn to create calculated columns and measures, manipulating and analyzing your data with a wide array of DAX functions including IF, SWITCH, and SUMX.
The course also emphasizes the importance of time intelligence functions, enabling you to track trends and patterns over time.
Building relationships between tables is a key aspect of any effective data model, and this course provides a clear and comprehensive approach.
You’ll learn how to connect your data tables for a holistic view using functions like USERELATIONSHIP, while also exploring the creation of hierarchies and data groups to organize and summarize your data in meaningful ways.
To solidify your understanding, the course incorporates practical activities, allowing you to apply the concepts learned in real-world scenarios.
You’ll also have the opportunity to use the Performance Analyzer to gauge your data model’s efficiency and explore the DAX Query View to understand how your data is being processed.
The course concludes with a series of case studies, demonstrating how these concepts are applied in various business contexts.
This hands-on approach, combined with the practical exercises and insightful case studies, provides a solid foundation for building powerful and efficient Power BI reports.
Power BI DAX Masterclass - Measures & Calculated Columns
You’ll dive headfirst into the core concepts of measures and calculated columns, learning how to leverage these powerful tools to create dynamic and insightful visualizations.
The course builds a strong foundation by introducing you to the creation of date tables using both CALENDARAUTO and CALENDAR, essential for performing meaningful time-based analysis.
You’ll explore a wide range of aggregation functions, including COUNT, COUNTA, COUNTBLANK, DISTINCTCOUNT, and COUNTROWS, allowing you to effectively summarize and manipulate your data.
The concept of SUMX, a powerful function for calculating sums across different rows, is explained in detail, and you’ll gain a deep understanding of filter context and row context, two crucial elements that govern how DAX operates.
The course then ventures into the realm of advanced DAX techniques, equipping you with the skills to use functions like CALCULATE, FILTER, ALL, ALLSELECTED, and ALLEXCEPT for complex data manipulations.
You’ll discover how to utilize logical operators, format numbers and dates, and even embark on a mini project to solidify your newfound knowledge.
The time intelligence section delves into functions like DATEADD, TOTALYTD, and DATESYTD, empowering you to perform powerful date-based analysis.
You’ll also learn about Quick Measures, a set of pre-built measures that can be used to create reports quickly and efficiently.
While it covers a wide range of topics, some users may find the pacing to be somewhat brisk.
Mastering DAX Calculations in Microsoft Power BI
This course starts with the fundamentals, guiding you through data types, operators, and basic formula construction.
You’ll quickly learn to format your code for readability and even use variables to simplify complex formulas.
The early emphasis on Power BI’s Quick Measures is particularly valuable, allowing you to rapidly create measures and gain immediate insights.
As you progress, you’ll delve deeper into DAX’s power, exploring the distinctions between calculated columns and measures.
Understanding context and the DAX calculation engine becomes critical, and the course masterfully guides you through various functions—aggregation, iteration, and logical functions—giving you the tools to manipulate and analyze data effectively.
Table functions take center stage as you learn to create virtual tables and filter data with precision.
The course expertly explores context management and relationships, using functions like ISFILTERED, ISCROSSFILTERED, and RELATED to provide granular control over your analysis.
The CALCULATE function is introduced as a powerful tool for modifying calculations based on context.
You’ll discover the elegance of variables in simplifying DAX formulas and enhancing their readability.
Virtual relationships, a technique for analyzing data lacking a physical relationship, are explored in depth, expanding your analytical capabilities.
Moving towards advanced concepts, the course dives into table functions, ranking functions, and time intelligence functions.
You’ll gain proficiency in manipulating virtual tables, summarizing data, and performing set operations.
The RANKX and TOPN functions empower you to rank data and select top values, while time intelligence functions like DATEADD, SAMEPERIODLASTYEAR, and YTD enable you to analyze trends over time.
The course concludes with a collection of advanced DAX formula combination examples, demonstrating how to tackle complex calculations with confidence.
You’ll learn how DAX can be leveraged to create advanced conditional formatting in Power BI, adding a layer of sophistication to your visualizations.
Beyond the core curriculum, the course explores crucial topics like virtual tables, iterating functions, and efficient Power BI development techniques, further solidifying your understanding of advanced DAX concepts.
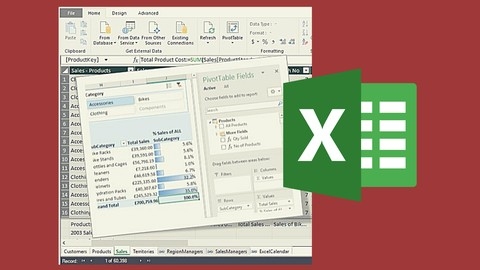
DAX Power Pivot - 10 Easy Steps for Beginners
You’ll start by building data models, importing external data, and learning how to manipulate it effectively.
You’ll then dive into creating pivot tables and exploring relationships between them, allowing you to gain insights from your data.
The course covers how to add Excel data to your data model, linking tables and importing entire Excel files.
The course progresses to the core of DAX, teaching you how to create calculated columns and measures.
These powerful tools enable you to perform custom calculations and complex analysis.
You’ll learn how to use them within the data model itself and within Excel.
You’ll also explore essential DAX functions like RELATED() and RELATEDTABLE(), allowing you to connect related data from different tables.
You’ll learn how to use COUNT() and DISTINCTCOUNT() to count records and unique values, along with techniques for working with date fields in calculated columns.
The course delves deeper with the CALCULATE() function, a key tool for manipulating calculations.
You’ll learn how to use it with operators like AND and OR, along with comparison operators and date functions.
Finally, you’ll explore using CALCULATE() with ALL(), enabling you to perform calculations across all records, ignoring existing filters.
DAX Power Pivot - 10 Easy Steps for Intermediates
You’ll start by mastering the fundamentals of Power Query, learning how to shape and clean your data before diving into the powerful world of DAX.
You’ll get a solid grounding in core DAX functions like CALCULATE, SUMX, and FILTER, building your ability to create impactful measures and gain valuable insights from your data.
The course progressively introduces more advanced concepts like context transitions and disconnected tables, equipping you with the tools to tackle complex data analysis challenges.
You’ll explore powerful techniques like Thresholds & Banding, enabling you to group and categorize your data for deeper understanding.
You’ll also delve into the creation of Key Performance Indicators (KPIs), allowing you to track and monitor your business objectives effectively.
The course culminates with an introduction to CUBE formulas, including CUBEVALUES, unlocking even more advanced functionalities within Power Pivot.
Microsoft Power BI DAX from Scratch
You’ll start with the fundamentals, such as syntax and basic date/time manipulation using functions like EDATE, EOMONTH, and DATEDIFF.
The course then guides you through text functions like LEFT, FIND, and COMBINEVALUES, allowing you to work with text data effectively.
Next, you’ll delve into logical functions like IF, AND, OR, and SWITCH, which are essential for making decisions within your DAX formulas.
You’ll learn about relationships and how to use functions like RELATED and CROSSFILTER to connect tables and analyze data across multiple sources.
The course continues with advanced DAX functions like FILTER, ALL, and EARLIER, enabling you to manipulate data in powerful ways.
You’ll then explore statistical functions like DISTINCTCOUNT and RANKX, which will help you analyze your data and gain insights.
The course also delves into TIME INTELLIGENCE functions like DATESYTD, DATEADD, and SAMEPERIODLASTYEAR, allowing you to analyze trends over time.
Finally, you’ll learn about information functions like CONTAINS and how to create NEW TABLE and QUICK MEASURE objects, which provide valuable tools for data analysis and visualization.
It’s well-structured, moving progressively from basic concepts to more advanced functions.
The course material is presented in a clear and concise manner, making it easy to follow and learn.


