Econometrics is a powerful field that combines economics, statistics, and mathematics to analyze economic data and test economic theories.
By understanding econometrics, you can gain valuable insights into how the economy works, make more informed decisions, and contribute to evidence-based policymaking.
Whether you’re an aspiring economist, a data scientist, or simply interested in understanding the forces that shape our world, learning econometrics can open doors to exciting opportunities.
Finding a comprehensive and engaging econometrics course can be challenging, with numerous options available online.
You’re looking for a course that strikes the right balance between theory and practice, taught by experts who can guide you through complex concepts and provide practical examples.
For the best econometrics course overall, we recommend Explaining the Core Theories of Econometrics on Udemy.
This course provides a solid foundation in econometric theory, covering essential topics like simple and multiple linear regression, hypothesis testing, and the Gauss-Markov assumptions.
It strikes a balance between mathematical rigor and intuitive explanations, making it accessible to learners with varying backgrounds.
While Explaining the Core Theories of Econometrics is our top pick, there are other excellent econometrics courses available, catering to different learning styles and focusing on specific areas within the field.
Keep reading to explore our curated list of recommendations and find the perfect econometrics course for your learning journey.
Explaining the Core Theories of Econometrics
Provider: Udemy
This Udemy course starts with the basics of simple linear regression, guiding you through using math to find the best-fitting line for your data.
You will learn how to determine if your results are meaningful through hypothesis testing, including the intuition behind it and the potential for estimator bias and variance.
You will also develop a solid understanding of the OLS estimator and its importance in ensuring accurate predictions.
You then move on to more advanced topics, like multiple linear regression, where you’ll use matrix notation to simplify your work with multiple variables.
The course covers the important Gauss-Markov assumptions, which are crucial for validating your models.
You will explore different methods for hypothesis testing, such as the RSS and Wald methods, which provide you with the ability to analyze data and draw conclusions.
The course then tackles more challenging concepts, examining what happens when the assumptions you make about your data don’t hold.
You will learn about common challenges like variable misspecification, multicollinearity, and heteroskedasticity, and how they can impact the accuracy of your analysis.
By understanding these potential problems, you can avoid common pitfalls and learn to build more robust models.
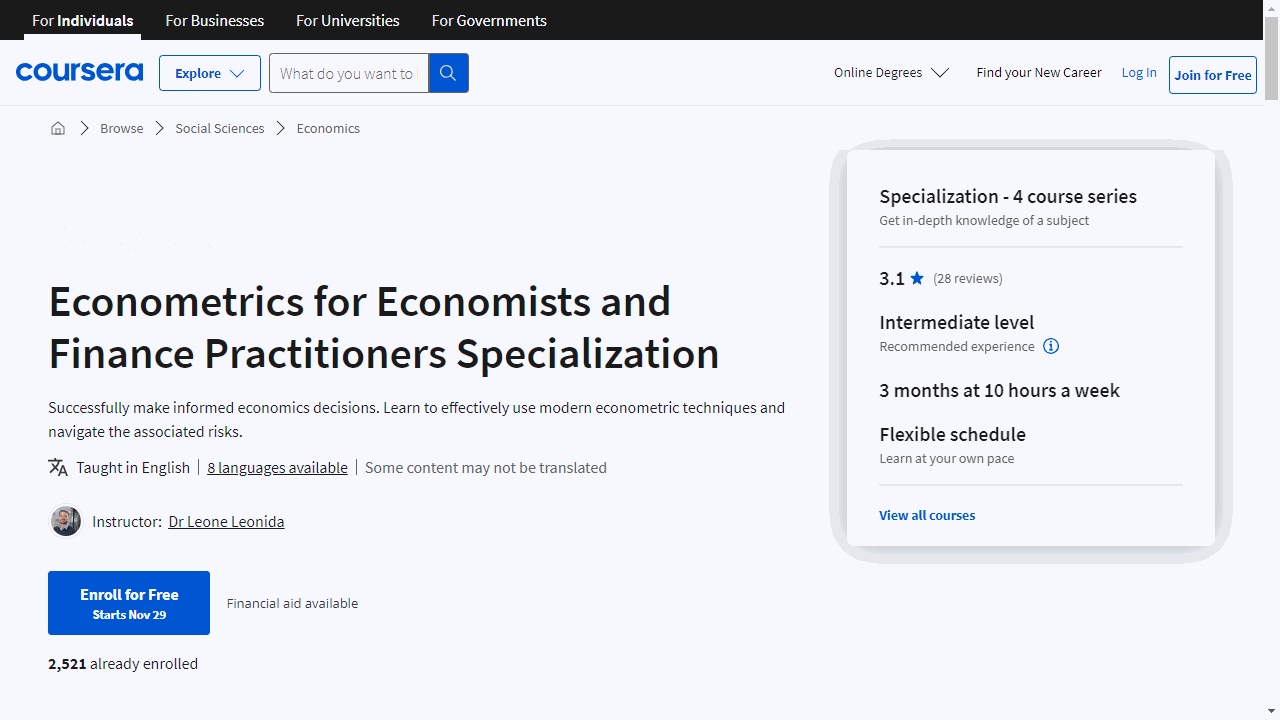
Econometrics for Economists and Finance Practitioners Specialization
Provider: Coursera
This specialization equips you with the tools to analyze economic data and make sound decisions.
You’ll begin with the fundamental Classical Linear Regression Model (CLRM) and the Ordinary Least Squares (OLS) estimator, grasping how to unveil hidden relationships within various data types like time series, cross-sectional, and longitudinal data.
Using R, you’ll learn to estimate regression parameters and understand the assumptions needed for their accuracy.
The course then guides you through testing economic theories with hypothesis testing, including performing t-tests and F-tests to validate your findings.
You’ll learn how to apply diagnostic testing to ensure the accuracy of your models.
For instance, you’ll estimate the Capital Asset Pricing Model with real data in R.
You’ll also tackle complex scenarios like panel data and simultaneous equations, and explore probability models to analyze qualitative data.
You’ll even learn how to build an Early Warning System for systemic banking crises using data from the World Bank.
Finally, you’ll delve into time series analysis, understanding stationary and non-stationary time series models and how to tackle problems with non-stationarity data.
You’ll explore techniques like ARCH(p) and GARCH(p,q) to analyze volatility in financial markets, especially useful in finance.
Through practical exercises and real-world examples, you’ll master forecasting using econometric models and evaluating their accuracy.
Econometrics and Statistics for Business in R & Python
Provider: Udemy
In this course, you’ll master practical econometric techniques used to analyze business data, gaining the ability to implement these techniques using both R and Python.
You will begin with Difference-in-differences, exploring its applications through real-world case studies.
The course provides a step-by-step guide, starting with data loading and manipulation and progressing to building and interpreting linear and logistic regression models.
The curriculum then advances to Google Causal Impact, a technique building upon Difference-in-differences to deliver a more powerful analysis.
You’ll learn to implement this technique using R and Python, working with real-world data such as Facebook’s stock price.
You’ll also learn Granger Causality, a technique used to understand how events can influence each other over time.
You’ll then discover Propensity Score Matching, a method used to account for self-selection bias when comparing different groups.
You’ll learn how to use T-tests to analyze the differences between groups, accounting for factors like stationarity.
Finally, you’ll delve into CHAID (Chi-square automatic interaction detection), a technique that helps you understand the main drivers of a specific outcome, learning how to use confusion matrices to evaluate the accuracy of your models.
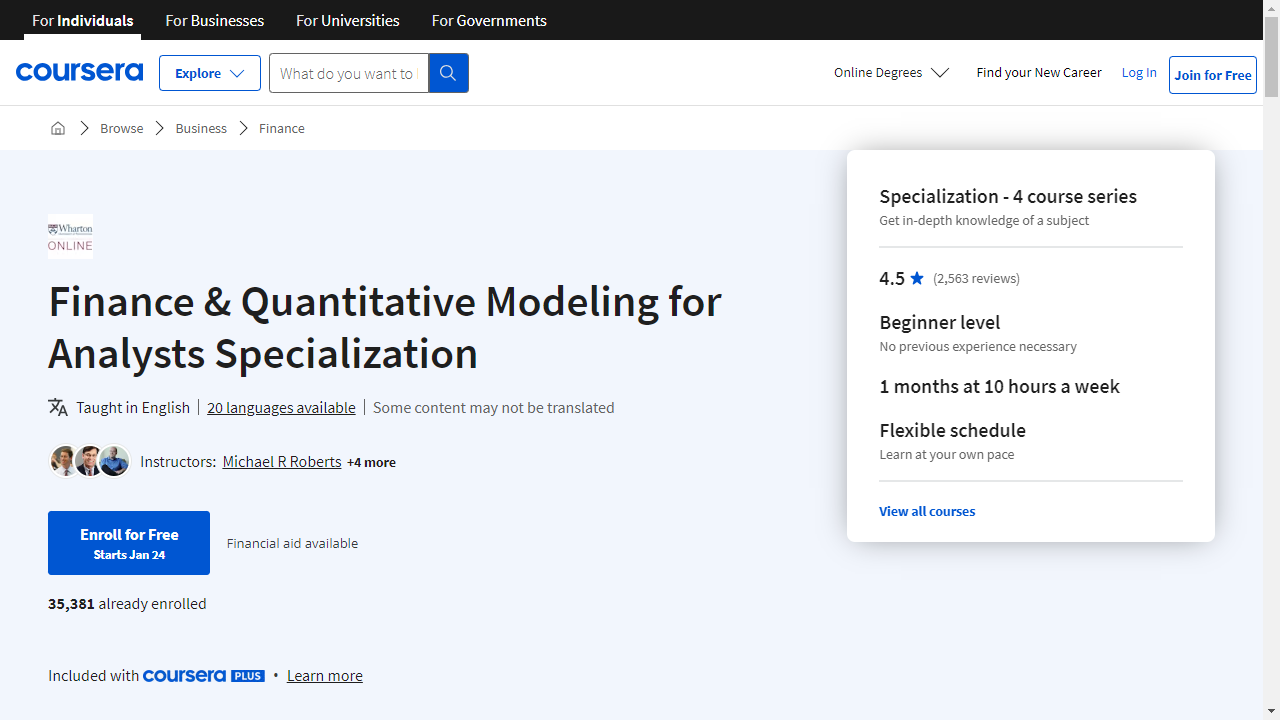
Finance & Quantitative Modeling for Analysts Specialization
Provider: Coursera
This Coursera specialization equips you with the skills to analyze business performance and predict future trends using quantitative models.
You will learn how to leverage spreadsheets, a powerful tool used by businesses to map data and forecast outcomes.
The curriculum introduces linear regression, probabilistic models, and regression analysis, providing a solid foundation for data-driven decision-making.
The program then dives into the practical applications of Microsoft Excel and Google Sheets, teaching you how to build models and decision trees.
You will explore techniques like the Monte Carlo method and linear programming to solve real-world business problems.
The specialization also delves into financial analysis, teaching you to interpret financial statements and understand the relationship between financial and non-financial metrics.
Finally, you will learn about corporate finance, including concepts like time value of money, risk-return tradeoff, and cost of capital.
You will gain practical experience with discounted cash flow analysis, net present value, internal rate of return, and payback period—essential tools for evaluating investments and making sound financial decisions.
This specialization will provide you with in-demand analytical skills, enhancing your value in any data-driven field.
You will be able to analyze data, build robust models, and make informed financial decisions, preparing you for success in today’s business world.
Econometrics: Solved Questions and Mathematical Proofs
Provider: Udemy
This Udemy course on econometrics focuses on practical problem-solving and the mathematical foundations of the field.
You will gain hands-on experience with various techniques, starting with the essentials like hypothesis testing and confidence intervals.
You will learn how to interpret p-values, select appropriate test statistics, and understand the concept of “power of a test.”
You will also master the interpretation of confidence intervals, a crucial skill for drawing meaningful insights from economic data.
The course then delves into the core of econometrics: simple and multiple linear regressions.
You will discover how to calculate crucial values like R-squared and adjusted R-squared, gaining a deep understanding of model fit.
The course explains the underlying assumptions of the Classical Linear Regression Model (CLRM), a cornerstone of econometric analysis.
You will also explore the Gauss Markov Theorem, understanding why Ordinary Least Squares (OLS) estimators are considered the best linear unbiased estimators under specific conditions.
You will then explore more advanced topics, including different functional forms like log-log and lin-log models, and learn how to use dummy variables effectively.
You will become adept at identifying and addressing common econometric issues, such as multicollinearity, heteroscedasticity, and autocorrelation.
The course equips you with tools like the Durbin-Watson d-test and the Breusch Godfrey test, enhancing the robustness of your regression models.
Through numerous practice questions covering these areas, you will be able to apply these concepts to real-world economic problems.
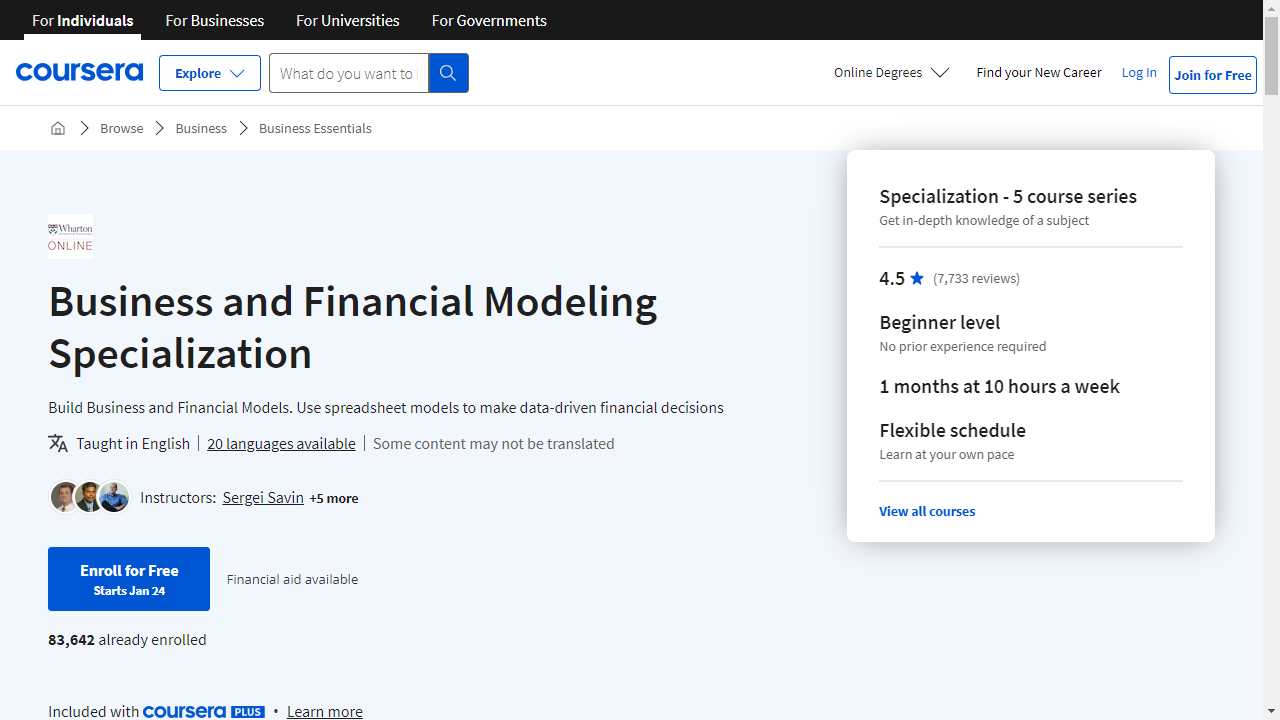
Business and Financial Modeling Specialization
Provider: Coursera
This specialization equips you with the skills to use data for smarter business decisions.
You’ll begin by mastering the fundamentals of quantitative modeling, learning how to leverage spreadsheet data for understanding past business activities and forecasting future trends.
Through techniques like linear regression and probabilistic models, you’ll build a strong quantitative modeling foundation.
Next, you’ll dive into the power of spreadsheets, using Excel or Google Sheets to create models for analyzing financial statements, including balance sheets and cash flow.
You’ll work with basic spreadsheet formulas and functions to build decision trees and predict future trends.
The specialization then delves deeper, teaching you how to build models that incorporate risk and uncertainty using techniques like Monte Carlo Simulation.
You’ll learn how to create predictive models and make optimal choices, even when dealing with complex, uncertain factors.
The course then shifts its focus to decision-making, showing you how to use your models effectively.
You’ll learn how to structure decision-making processes for optimal results, exploring techniques like linear programming and the Solver tool in Excel.
Finally, you’ll put your knowledge into practice with a capstone project using real-world data from Wharton Research Data Services (WRDS).
This project will give you hands-on experience with financial modeling, allowing you to analyze opportunities and minimize risk.
You’ll present your findings and recommendations in a professional PowerPoint presentation, showcasing the skills you’ve gained throughout the specialization.
Econometrics: Simple Linear Regression (University Students)
Provider: Udemy
This Econometrics course on Udemy teaches you how to use simple linear regression to understand how different variables relate to each other.
You begin with the fundamentals, learning about different types of data like cross-sectional and time series data.
You then explore how regression equations describe relationships in a sample and across an entire population, discovering how to interpret these equations to understand trends in your data.
The course then dives into the Ordinary Least Squares method (OLS), a powerful tool used to estimate the slope and intercept of a regression line.
You learn the intuition behind how this method works, going step-by-step through the process of deriving these estimators using clear, easy-to-follow examples.
You also learn how to apply the formulas to real data, gaining experience with the algebraic properties of OLS.
Through this combination of practical examples and important theoretical explanations, you develop a solid understanding of the core concepts of simple linear regression, a foundational tool in econometrics.
You leave the course equipped to analyze data, draw meaningful conclusions about relationships between variables, and apply this knowledge to real-world economic problems.
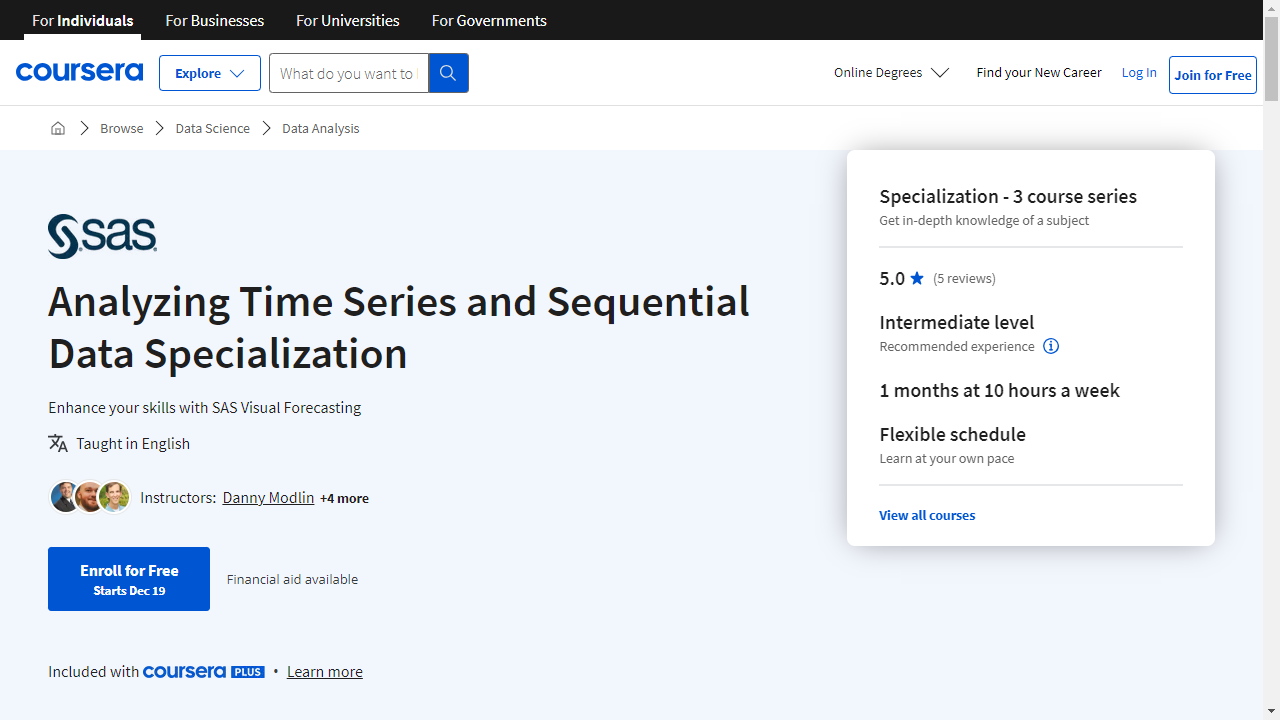
Analyzing Time Series and Sequential Data Specialization
Provider: Coursera
This specialization goes beyond basic econometrics by teaching you how to find patterns in data that changes over time, like stock prices or weather patterns.
You’ll learn how to smooth, transform, and analyze the frequency of data using techniques like spectral analysis and motif analysis.
Imagine building a large-scale forecasting system using powerful tools like SAS.
This specialization shows you how to prepare data, create models, and select the best model for your needs.
You’ll even discover how to improve the accuracy of your forecasts.
This specialization takes you deep into the world of modeling time series data, teaching you how to refine, interpret, and even combine different modeling approaches.
You’ll master traditional statistical methods like the Box-Jenkins approach, which uses models like ARMA and ARIMA to find trends and seasonal patterns.
You’ll explore the Bayesian approach, which helps you deal with uncertainty in your data.
You’ll even learn how to use powerful machine learning algorithms like gradient boosting and recurrent neural networks to handle complex relationships in your data.
Also check our posts on:


