Econometrics is a powerful tool for economists and finance practitioners, enabling them to analyze data, test hypotheses, and make informed decisions based on rigorous statistical methods.
By mastering econometrics, you can delve into the complexities of economic phenomena, understand the relationships between variables, and predict future trends.
This knowledge is invaluable for anyone working in fields that rely on data-driven insights, from policy analysis to investment strategies.
Finding the right econometrics course on Coursera can be challenging, with so many options available.
You’re looking for a program that’s comprehensive, engaging, and taught by experts in the field, but also fits your learning style and goals.
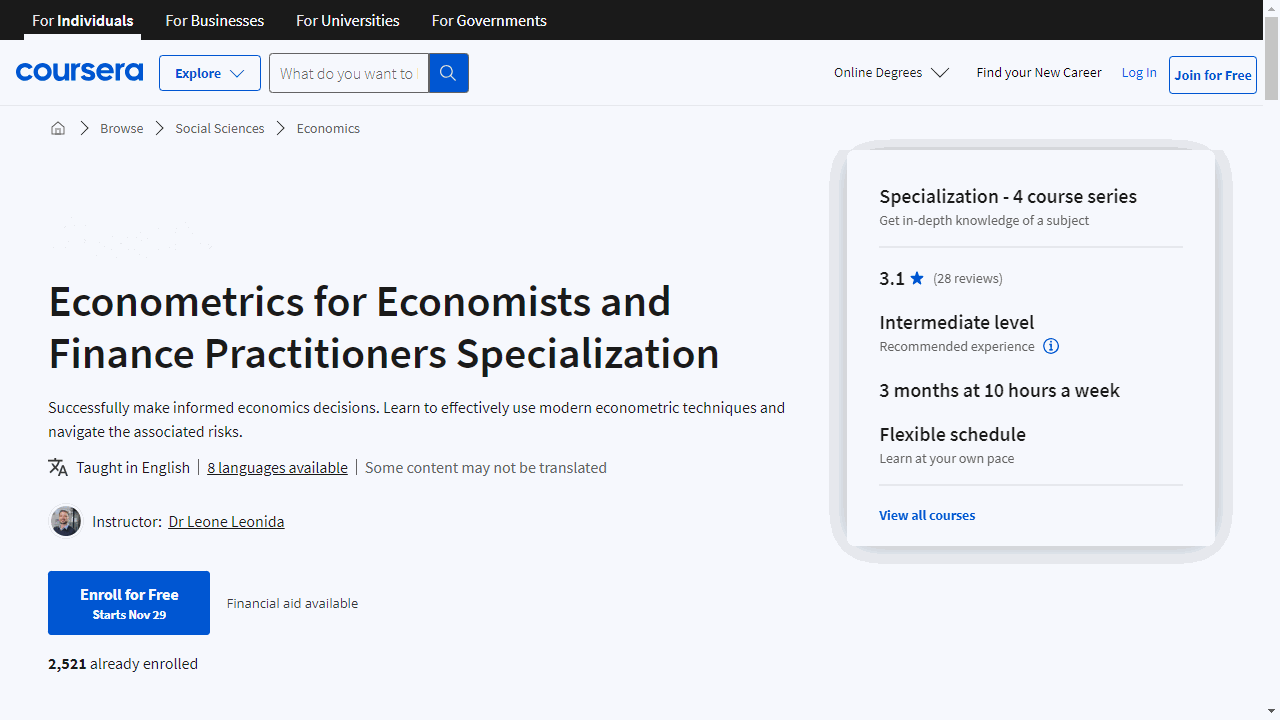
We recommend the Econometrics for Economists and Finance Practitioners Specialization as the best course overall.
This specialization offers a comprehensive journey through the core concepts of econometrics, covering topics like linear regression, hypothesis testing, and time series analysis.
Taught by experienced professors from the Queen Mary University of London, the course provides a strong theoretical foundation alongside practical applications using the popular R programming language.
But this is just one of the many great econometrics courses available on Coursera.
Keep reading to discover our recommendations for beginner-friendly introductions, advanced courses for those seeking to deepen their knowledge, and even specialized programs focused on specific applications like time series analysis.
Econometrics for Economists and Finance Practitioners Specialization
Starting with “The Classical Linear Regression Model,” you’ll grasp the essentials of econometrics, learning to apply the OLS estimator and progressing from simple to multiple regression analyses.
The course simplifies complex concepts, making it accessible if you have a basic understanding of algebra and graphing.
Practical application is a key focus, with R software training to analyze real data, such as estimating the Capital Asset Pricing Model.
Building on that foundation, “Hypotheses Testing in Econometrics” introduces you to the statistical backbone of econometrics.
You’ll delve into hypothesis testing, understanding the rationale behind the OLS approach and mastering diagnostic tests.
This course assumes familiarity with basic statistics and the content from the preceding course, ensuring a seamless learning progression.
“Topics in Applied Econometrics” expands your toolkit, addressing specific challenges in econometric modeling.
You’ll navigate through parameter identification, panel data intricacies, and the nuances of qualitative variables.
The course culminates in applying these concepts to build an Early Warning system for banking crises, using World Bank data.
Lastly, “The Econometrics of Time Series Data” hones in on the unique aspects of time series analysis.
You’ll explore stationary and non-stationary processes, cointegration, and volatility forecasting, applying these techniques to real-world economic indicators like GDP growth.
This course is the capstone of the specialization, synthesizing all prior learning.
Each course is rich with practical skills, from data management to model estimation and validation, all through the lens of R software.
You’ll emerge with the ability to interpret models and leverage them for strategic decision-making.
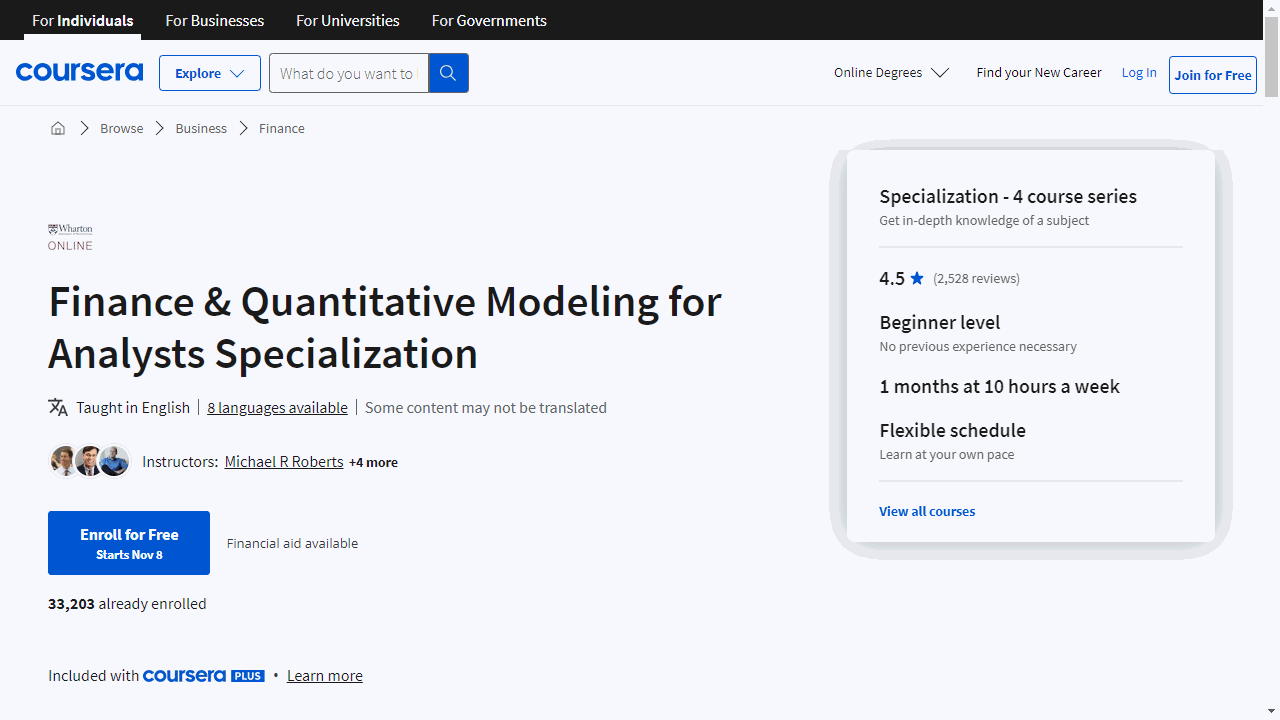
Finance & Quantitative Modeling for Analysts Specialization
The journey begins with “Fundamentals of Quantitative Modeling,” where you’ll learn to interpret and construct quantitative models.
This course isn’t just about crunching numbers; it’s about understanding the stories they tell about a business’s trajectory.
You’ll gain insight into the types of models used in the industry and acquire the foundational skills to build your own.
Moving on to “Introduction to Spreadsheets and Models,” you’ll discover the power of spreadsheets as a formidable tool for analysis.
This course equips you with the know-how to navigate Excel or Sheets, enabling you to transform raw data into actionable insights.
It’s a hands-on experience that prepares you to construct models that can inform your decision-making process.
For those less familiar with the financial world, “Financial Acumen for Non-Financial Managers” offers a clear view into how financial and non-financial data converge to influence a company’s performance.
You’ll delve into financial statements and learn to use data to predict and strategize for the future.
This course is designed to enhance your ability to make informed financial decisions without requiring a background in finance.
Lastly, “Introduction to Corporate Finance” provides a comprehensive overview of finance fundamentals.
You’ll explore concepts such as the time value of money and risk-return tradeoff, applying them to various scenarios from personal finance to corporate investments.
This course is about connecting theory with practice, ensuring you can apply concepts like discounted cash flow analysis to real-world situations.
Each course is infused with essential skills like regression analysis and cash flow analysis, ensuring that you’re not just learning theory but also acquiring practical expertise.
The specialization is designed to be accessible, avoiding jargon and focusing on clear, applicable knowledge.
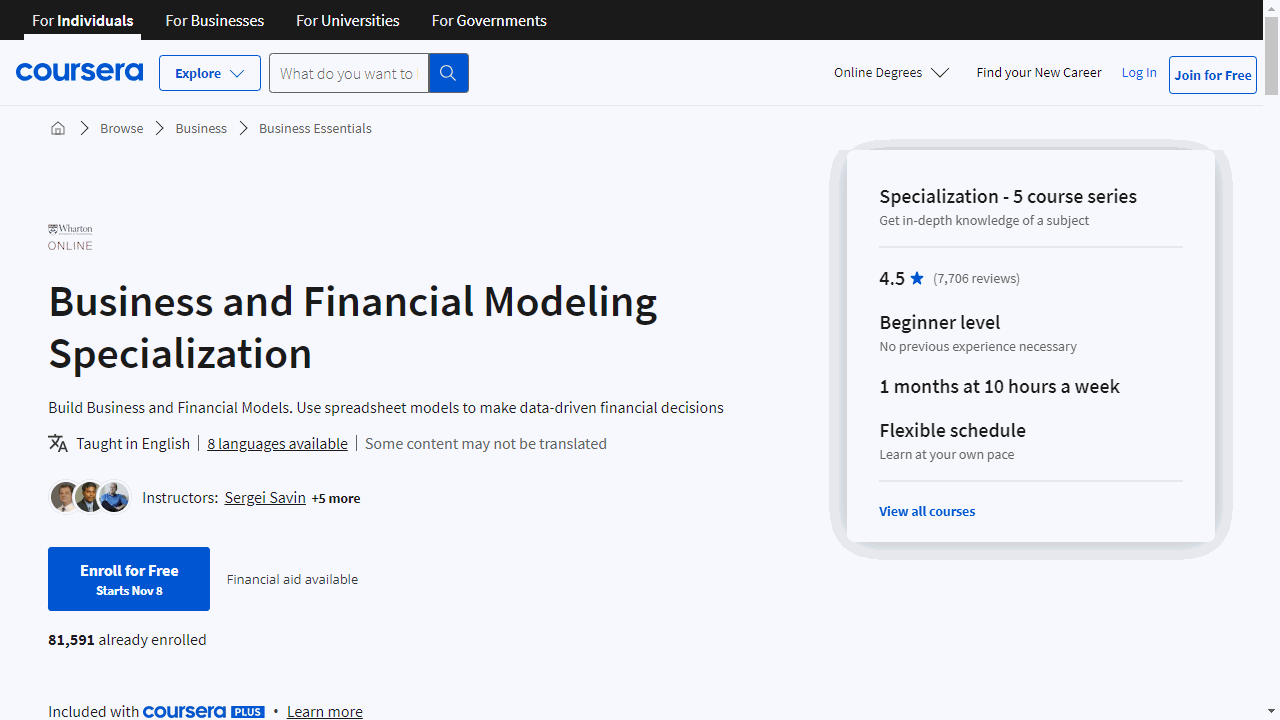
Business and Financial Modeling Specialization
This specialization begins with “Fundamentals of Quantitative Modeling,” where you’ll grasp the essentials of using data to analyze business activities and forecast future trends.
This course lays the groundwork for creating models that can be applied to your own business challenges.
Next, “Introduction to Spreadsheets and Models” demystifies the spreadsheet, a ubiquitous tool in financial analysis.
You’ll learn practical spreadsheet functions and formulas that are crucial for organizing and projecting your business’s financial data.
In “Modeling Risk and Realities,” the focus shifts to the unpredictable nature of business.
Here, you’ll learn to build models that incorporate elements of risk and uncertainty, equipping you with the foresight to navigate complex decision-making landscapes.
“Decision-Making and Scenarios” further refines your ability to use quantitative models for business decisions.
This course teaches you to structure decision-making processes effectively, enhancing your capability to weigh alternatives and outcomes.
In the “Wharton Business and Financial Modeling Capstone,” you’ll develop a business strategy based on a data model you’ve constructed, using real-world data from Wharton Research Data Services.
This hands-on experience culminates in a professional presentation, showcasing your ability to synthesize data and analysis into actionable business insights.
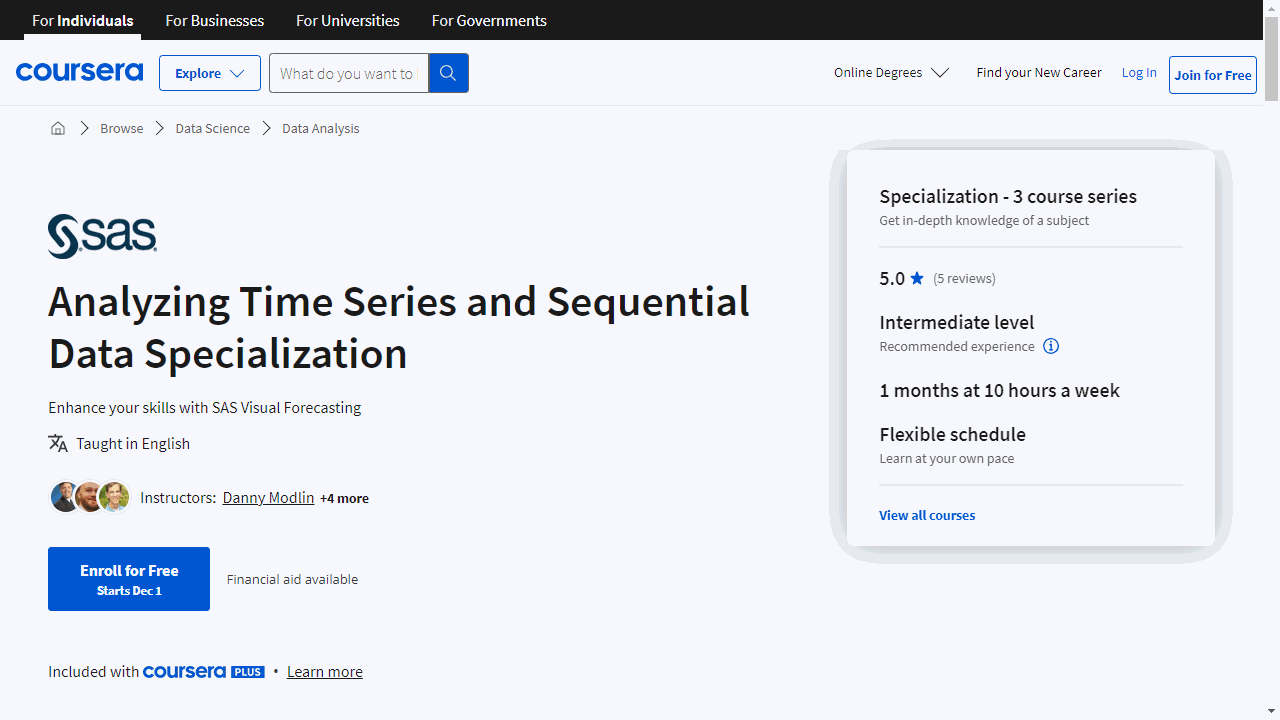
Analyzing Time Series and Sequential Data Specialization
This specialization is great if you are looking to deepen your understanding of time series analysis and forecasting, and it’s packed with practical, real-world applications.
The first course, “Creating Features for Time Series Data,” equips you with the tools to expertly navigate data exploration.
You’ll learn to identify and extract meaningful features from time sequences using advanced techniques such as binning and smoothing.
The course also delves into spectral and singular spectrum analysis, teaching you to uncover hidden patterns in your data.
A basic grasp of statistics and some familiarity with matrices will set you up for success in this course.
Moving on, “Building a Large-Scale, Automated Forecasting System” is designed for those ready to tackle big data challenges.
You’ll get hands-on experience with SAS Visual Forecasting tools, learning to craft and refine forecasting models.
This course is ideal if you’re keen on enhancing your machine learning expertise and have some coding background.
It’s a practical dive into managing and interpreting large-scale data sets.
Lastly, “Modeling Time Series and Sequential Data” offers a comprehensive look at various modeling techniques.
From the Box-Jenkins method to Bayesian frameworks and machine learning algorithms, this course covers a broad spectrum of strategies.
You’ll learn to build models that can handle complex, nonlinear relationships and improve forecasting accuracy by combining different approaches into ensemble and hybrid models.
While prior knowledge of SAS software and machine learning is beneficial, it’s not mandatory.
Overall, this specialization provides a robust foundation in econometrics, with a strong emphasis on practical skills and software tools.
Data Analysis with R Specialization
The first course in this specialization, offered by Duke University, provides a strong foundation in probability and data exploration.
You’ll learn various sampling methods and how they impact analysis.
Get hands-on practice with R and RStudio to build your skills in data visualization and summary statistics.
These are key skills that will help you interpret and understand data.
Building on that base, the second course dives into statistical inference methods.
You’ll gain practical experience running hypothesis tests, interpreting p-values, and reporting results.
Using real data examples, you’ll learn how to express the uncertainty of estimates.
More work with R will reinforce these concepts so you can apply them in the real world.
The specialization concludes with a course on linear regression modeling.
You’ll discover how to assess relationships between variables in data using simple and multiple linear regression.
Can factors like a mother’s characteristics predict her child’s test scores? You’ll find out.
More training with R will give you the tools to fit, examine, and use regression models to unlock insights.
Econometrics: Methods and Applications
“Econometrics: Methods and Applications”, taught by the Erasmus University Rotterdam, provides a great opportunity to dive deep into econometrics, offering challenging assignments and a wealth of background material that will keep you engaged throughout the course.
One of the standout features of this course is the quality of the lecture videos.
They are clear and concise, making it easier to grasp the complex concepts presented in the course.
Moreover, the course is well-structured, with a pleasant pace that allows you to fully understand each topic before moving on to the next.
The course is particularly beneficial for those who are comfortable with matrices and mathematics, as it provides you with very interesting tools and demonstrations.
It covers some common topics in econometrics in good detail, and it’s a rigorous condensed econometrics course with clear instruction.
This makes it a great choice for individuals looking to start with Econometric models at the most fundamental level.
Another positive aspect of this course is the outstanding support from the teaching staff.
They are always ready to answer your questions and guide you through the course material. This makes the learning process more enjoyable and less stressful.
Lastly, the course provides a good foundation for future studies in econometrics.
It focuses on some fundamental aspects and properties of cross-sectional data and time series data, equipping you with the knowledge and skills you need to carry out your future quest regarding any empirical topic by yourself.
Enjoyable Econometrics
“Enjoyable Econometrics” is a wonderful course by the Erasmus University Rotterdam, perfect if you are eager to grasp econometrics without the usual dryness of the subject.
It begins with a personal introduction to your instructor, fostering a comfortable learning environment from the get-go.
What sets this course apart is its application of econometric concepts to relatable scenarios.
You’ll tackle questions like the impact of home advantage in football or the gender gap across countries, making abstract statistics tangible and relevant.
The course cleverly intertwines sports, history, and current events, ensuring a diverse range of interests are catered to.
Whether it’s analyzing Max Verstappen’s performance improvements or exploring inflation trends in historical contexts, the content remains accessible and engaging.
As you delve deeper, “Enjoyable Econometrics” smoothly transitions into more sophisticated methods.
You’ll learn multiple regression through creative examples, such as forecasting the Color of the Year, and examine economic phenomena like World Cup spending.
The interactive approach encourages you to apply your newfound knowledge to various examples, reinforcing learning through practice.
This method proves effective in understanding complex topics like inflation volatility and the nuances of economic crises.
Practical Time Series Analysis
This course offers a comprehensive introduction to time series analysis, starting from the basics and gradually moving to more advanced topics.
This means that even if you’re new to the subject, you’ll be able to follow along and gain a solid understanding.
One of the strengths of this course is its balance between theory and practice.
You’ll find many examples throughout the course that will help you better understand the material.
Plus, there are practical exercises and quizzes that allow you to apply what you’ve learned, which is crucial for truly mastering the subject.
The course covers a wide range of models, including ARIMA, SARIMA, and exponential smoothing.
This means you’ll gain a broad understanding of the different tools and techniques used in time series analysis.
The course uses R for its programming exercises, which I don’t find ideal, but it’s not the end of the world.
Another advantage of this course is that it provides a good refresher on basic statistics.
So, even if it’s been a while since you’ve taken a stats class, you’ll be able to catch up quickly.
The course also offers a detailed look at other tools used for analyzing time-series data, such as autocorrelation and partial-autocorrelation.
Despite some criticisms, several students found the course to be one of the best they’ve taken on Coursera, praising its practicality and thoroughness.
So, if you’re looking for a course that provides a practical understanding of time series analysis, this could be the one for you.
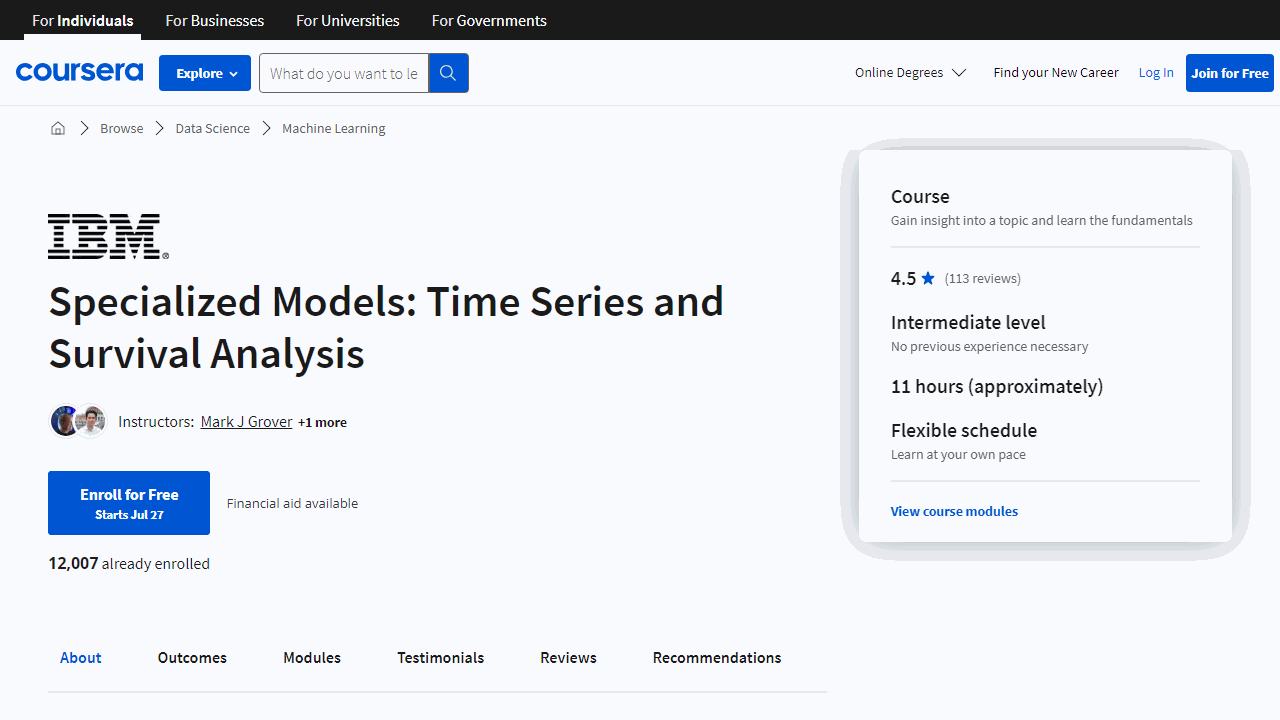
Time Series And Survival Analysis
This course is part of the IBM Machine Learning Professional Certificate.
It covers a wide range of time series analysis topics with a special focus on survival analysis, giving you a broad understanding of the field.
One of the standout features of this course is its practicality.
The Python code templates provided are not just theoretical exercises, but useful tools you can apply to real-life problems.
The course material is particularly useful if you’re a data analyst or machine learning practitioner.
It provides a comprehensive overview of the topic, covering a large area of time series analysis.
This includes both classical statistical learning algorithms and deep learning techniques, giving you a well-rounded understanding of the field.
The survival analysis part of the course is particularly interesting and provides a unique perspective on the subject matter.
Frequently Asked Questions
What is Econometrics and why is it important?
Econometrics is a branch of economics that applies statistical and mathematical methods to analyze economic data and test economic theories.
It plays a crucial role in quantifying and modeling economic relationships, evaluating policies, and forecasting future trends.
Econometrics is essential for evidence-based policymaking, business decision-making, and advancing economic research.
What skills do you need to be good at Econometrics?
To excel in econometrics, you should have strong quantitative skills, including proficiency in mathematics (calculus, linear algebra, probability, and statistics), programming (such as R, Python, STATA, or MATLAB), and data management.
Additionally, critical thinking, problem-solving abilities, and a deep understanding of economic theory are essential.
What common tools should Econometrics beginners learn?
Econometrics beginners should familiarize themselves with statistical software packages like R, Python (with libraries like NumPy, Pandas, and Statsmodels), STATA, or EViews.
You should also learn how to use spreadsheet software like Microsoft Excel or Google Sheets for data manipulation and analysis.
What jobs can you get with Econometrics skills?
Econometrics skills are highly valued in various industries, including finance, consulting, government agencies, research institutions, and academia.
Potential job roles include econometrician, data analyst, financial analyst, economic consultant, policy analyst, and research associate.
What should I look for in an Econometrics course for beginners?
When selecting an econometrics course for beginners, look for a comprehensive curriculum that covers fundamental concepts, such as probability and statistics, linear regression models, and hypothesis testing.
The course should also provide hands-on experience with real-world data sets and statistical software.
Additionally, ensure that the course is taught by experienced instructors with a strong background in econometrics.
What are the common uses of Econometrics across various industries?
Econometrics has numerous applications across industries.
In finance, it is used for portfolio optimization, risk management, and forecasting market trends.
In marketing, econometrics helps analyze consumer behavior, demand patterns, and pricing strategies.
In healthcare, it is employed for cost-benefit analysis and evaluating the effectiveness of treatments.
In environmental studies, econometrics models the impact of policies on pollution and resource utilization.
Also check our posts on:
