Excel is a powerful spreadsheet software that has become an essential tool in today’s workplace.
From basic data entry and organization to advanced data analysis and visualization, Excel empowers individuals and businesses to make informed decisions and streamline their operations.
Learning Excel can significantly enhance your productivity, problem-solving abilities, and career prospects across various industries.
However, with countless Excel courses available online, finding the one that perfectly aligns with your needs and learning style can feel like searching for a needle in a haystack.
You’re seeking a course that’s comprehensive, engaging, and taught by experts who can guide you from beginner to advanced levels, but also fits your budget and schedule.
Based on our extensive research and analysis, we believe Excel Skills for Business Specialization on Coursera stands out as the best overall Excel course.
This specialization offers a structured learning path, starting with the fundamentals and progressing to advanced techniques, making it suitable for learners of all levels.
It covers a wide range of topics, from basic formulas and functions to data analysis, visualization, and automation.
While Excel Skills for Business Specialization is our top recommendation, we understand that you might be looking for something more specific or tailored to your individual needs.
That’s why we’ve curated a diverse selection of Excel courses covering various aspects of the software, from data analysis and VBA programming to financial modeling and automation.
Excel Skills for Business Specialization
Provider: Coursera
This Coursera specialization, “Excel Skills for Business,” is a great choice if you want to learn how to use Microsoft Excel for work.
You will go from the basics to advanced techniques, which makes it perfect whether you’re just starting or want to improve your skills.
You’ll begin with the “Essentials” course, where you’ll learn the basics like formulas, functions, and charts.
You’ll practice these skills by working on business problems so you feel comfortable using Excel.
The “Intermediate I” course teaches you more advanced things like concatenation, pivot tables, and pivot charts.
This will help you understand and manage lots of data.
You’ll also see how a fictional character named Uma handles new tasks at her job.
In “Intermediate II”, you’ll learn about data validation, macros, and lookup tables.
These tools will help you make spreadsheets that prevent mistakes, do things automatically, and provide information to help make decisions.
Here, you’ll follow Alex, an Excel consultant, as he solves real-world spreadsheet problems.
Finally, the “Advanced” course helps you become an Excel expert.
You’ll learn advanced formulas, sophisticated lookups, and how to clean up data for analysis.
You’ll also learn how to design spreadsheets and create professional dashboards.
Microsoft Excel - Excel from Beginner to Advanced
Provider: Udemy
This course guides you from the basics of Microsoft Excel to becoming an advanced user.
You’ll begin with fundamentals like navigating the interface, entering data, and creating basic formulas.
You’ll then master essential shortcuts and discover how to format your worksheets for maximum impact.
As your skills grow, you’ll explore the power of Excel’s advanced features.
You’ll learn to create charts and PivotTables, tools that transform raw data into insightful visuals.
You’ll become proficient in managing lists, validating data, and importing and exporting data between Excel and other programs, skills essential for organizing and analyzing information effectively.
This course doesn’t stop at the fundamentals.
You’ll delve into the world of Visual Basic for Applications (VBA), a powerful programming language within Excel.
You’ll begin with Excel’s built-in Macro Recorder to automate those tedious, repetitive tasks.
From there, you’ll graduate to writing your own custom macros with VBA, unlocking even greater levels of automation.
Imagine streamlining your work, effortlessly manipulating data, and generating custom reports with just a few clicks – VBA empowers you to do just that.
Business Problem Solving Specialization
Provider: Coursera
This specialization equips you with the skills to elevate your spreadsheet abilities and solve real-world business problems.
You will start by learning how to classify data and utilize Excel’s Solver feature to pinpoint optimal solutions.
You will also learn how to identify opportunities and risks within a business process.
Next, you will explore data analysis tools within Excel, focusing on single and multiple regression analysis.
You will gain experience building and interpreting regression models, which are essential for data-driven decision-making.
This will empower you to solve business problems using data analysis techniques.
Finally, you will apply your knowledge to a capstone project, tackling a real-world business problem using advanced data analysis tools such as Correlation Analysis and Sensitivity Analysis.
These techniques allow you to uncover hidden relationships within data and understand how changes in one variable can impact others, solidifying your expertise in Microsoft Excel for business analysis and problem-solving across various industries.
Microsoft Excel: Advanced Excel Formulas & Functions
Provider: Udemy
This course takes you on a journey to becoming an Excel power user.
You start with the foundation: Excel formulas.
You’ll master syntax, understand different reference types (like fixed and relative references), and learn handy shortcuts to navigate your spreadsheets with ease.
You’ll even learn how to troubleshoot common formula errors like a pro using Excel’s built-in auditing tools.
You’ll then dive into the world of logic and calculations.
You’ll learn to use IF statements with logical operators (AND, OR, NOT) to create complex decision-making formulas.
The course also covers statistical functions, from the basics like COUNT, MEDIAN, and MODE to advanced functions like SUMPRODUCT for row-level calculations.
You’ll discover the power of conditional aggregation with functions like SUMIFS, COUNTIFS, and AVERAGEIFS, which are essential for building interactive dashboards and analyzing data like a pro.
You’ll explore lookup and reference functions like VLOOKUP, INDEX/MATCH, and OFFSET, essential for managing and retrieving data from large datasets.
You’ll learn how to manipulate text like a pro using functions like LEFT, MID, RIGHT, and SEARCH.
You’ll master date and time functions, becoming comfortable with calculations involving dates, extracting specific time periods, and using functions like TODAY, NOW, YEAR, MONTH, and DAY.
This course even covers Excel’s latest and greatest feature: Dynamic Array formulas.
These formulas will revolutionize your spreadsheets by automatically spilling results into multiple cells, making data manipulation a breeze.
You’ll explore functions like SORT, FILTER, UNIQUE, SEQUENCE, and RANDARRAY – designed to unlock the true potential of dynamic arrays.
Finally, you’ll uncover some hidden gems: lesser-known but incredibly powerful functions like INDIRECT, HYPERLINK, WEBSERVICE, and FILTERXML, allowing you to create custom references, build links, and even fetch real-time data from the web.
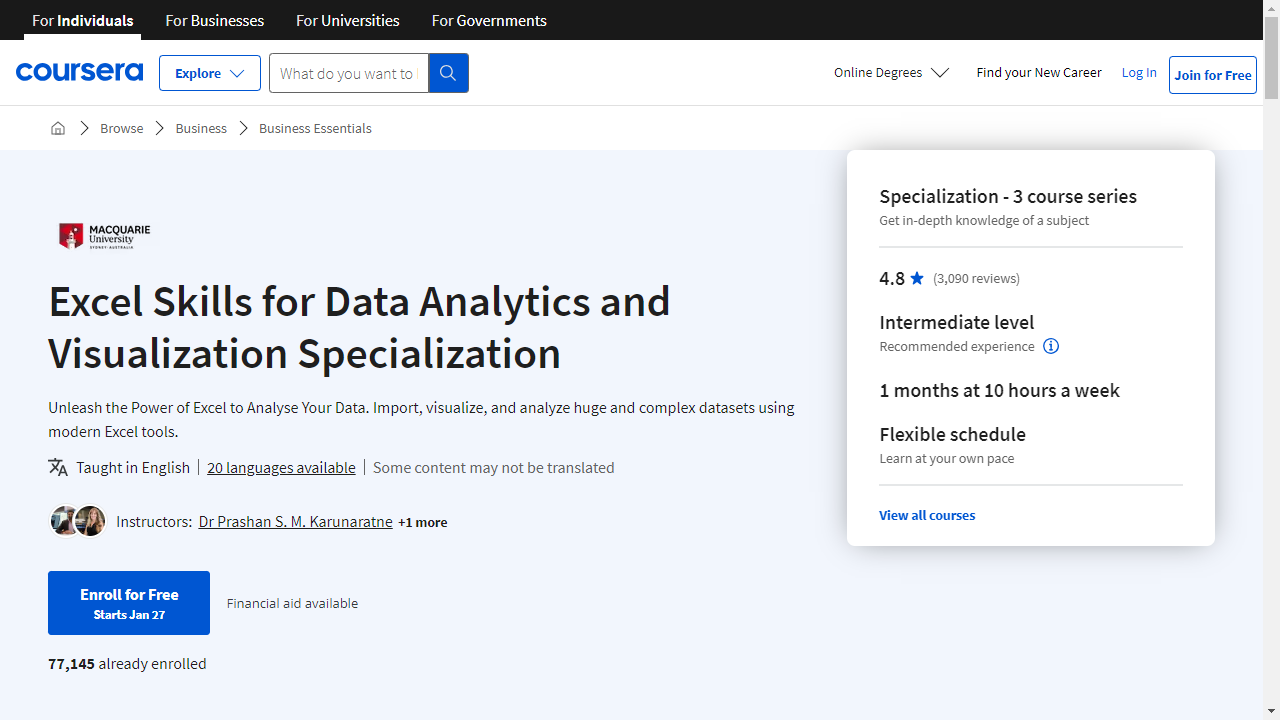
Excel Skills for Data Analytics and Visualization Specialization
Provider: Coursera
This Coursera specialization teaches you how to use Excel like a pro for data analysis and visualization.
You’ll start with the basics and progress to advanced techniques, learning how to use Excel’s powerful tools.
The first course teaches you the fundamentals of data analysis in Excel.
You’ll learn to clean, organize, and prepare data for analysis using Excel’s tools and functions.
You’ll discover how to automate your analysis using Named Ranges and Tables, making your work more efficient.
The course also covers logical and lookup functions, which are essential for transforming, linking, and categorizing data.
In the second course, you’ll explore data visualization in Excel.
This course teaches you how to use charts, graphs, and other visual tools to present data in a clear and compelling way.
You’ll learn to create dynamic visualizations with conditional formatting, sparklines, and macros.
You’ll also learn about pivot tables and pivot charts, which are powerful tools for summarizing and filtering data.
The final course covers Excel’s Power Tools: Power Query, Power Pivot, and Power BI.
You’ll learn how to use Power Query to automate data import and preparation.
You’ll learn how to analyze large datasets with Power Pivot and use DAX, a powerful formula language for performing advanced analytics.
The course concludes with an introduction to Power BI, where you’ll learn to create interactive dashboards and reports.
Microsoft Excel: Data Analysis with Excel Pivot Tables
Provider: Udemy
This course equips you with the skills to analyze and visualize data like a pro using the power of Excel Pivot Tables.
You’ll begin your journey by understanding the fundamentals of Pivot Tables, using the familiar IMDb Movie Database as your playground.
You’ll learn how to structure data for analysis, create your first Pivot Table, and navigate the intuitive Pivot Table Field List, allowing you to easily filter and sort your data.
As you progress, you’ll uncover the secrets of formatting and customizing your Pivot Tables.
From applying different number formats to using advanced conditional formatting to highlight key trends, you’ll have complete control over the look and feel of your analysis.
You’ll master various sorting, filtering, and grouping techniques, using tools like label filters, value filters, and slicers to zero in on specific insights within your data.
This course goes beyond the basics, teaching you how to enrich your data analysis with calculated values and fields.
You’ll be able to calculate percentages, running totals, and other essential metrics directly within your Pivot Tables.
You’ll even learn how to build formulas to create custom calculated fields, unlocking new perspectives from your data.
Finally, you’ll discover how to transform your data into compelling visuals with Excel Pivot Charts.
You’ll master the art of creating different chart types, customizing their appearance, and even combining them with your Pivot Tables to build dynamic dashboards.
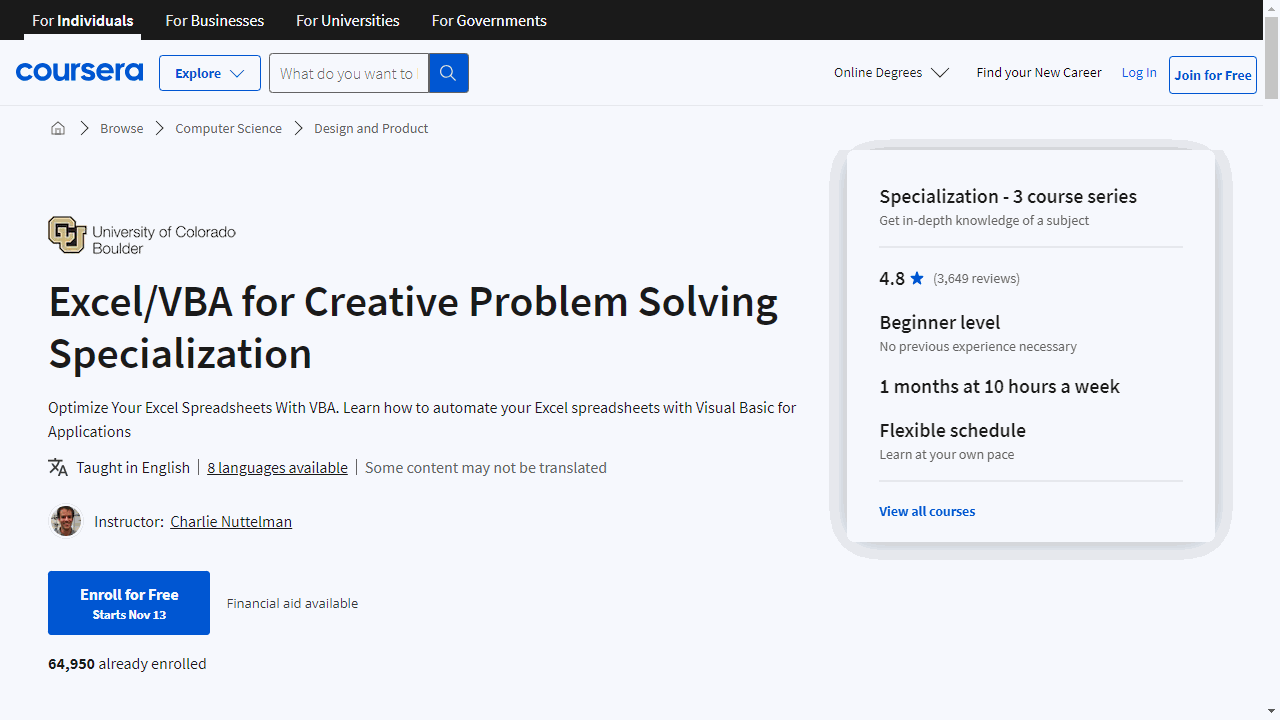
Excel/VBA for Creative Problem Solving Specialization
Provider: Coursera
This Coursera Specialization on Excel/VBA for Creative Problem Solving is a good option if you want to learn how to use VBA to solve problems in Excel.
Think of it like learning a new language, but instead of speaking, you are writing code.
The first part eases you into the world of VBA.
You learn how to create macros, which are like shortcuts, to automate tasks in Excel, like copying data or formatting cells.
You also learn how to create your own functions, which are like mini-programs within Excel, to perform specific calculations or actions.
You even learn how to use Goal Seek and Solver, powerful tools that help you find the best solutions to tricky problems.
As you progress to the second part, you dive deeper into more advanced VBA techniques.
You learn how to wrangle data with arrays, import and export data from text files, and work with text strings.
You even get to build interactive user forms, which are like custom windows in Excel, making your spreadsheets more user-friendly.
The best part is, you get to apply everything you learn through hands-on projects, receiving feedback from fellow learners.
This practical experience helps you solidify your VBA skills and build a portfolio of real-world projects.
Beginner to Pro in Excel: Financial Modeling and Valuation
Provider: Udemy
This Udemy course takes you from Excel newbie to financial modeling guru.
You’ll start with the basics, learning about rows, columns, formatting cells, and using simple formulas.
As you progress, you’ll discover time-saving tricks like keyboard shortcuts and learn to organize data with tools like “Text to Columns.”
You’ll then dive into the powerful world of Excel functions.
You’ll master essential functions like IF for logic, SUM for adding values, COUNT for counting, and AVERAGE for calculating averages.
You’ll learn how to use VLOOKUP and INDEX MATCH to find specific data and explore advanced functions like IFERROR for error handling and CHOOSE for building flexible models.
The course then shifts gears to financial modeling.
You’ll learn the fundamentals of building models, including best practices, forecasting techniques, and how to model key financial statements like the Income Statement and Balance Sheet.
You’ll build a Profit and Loss (P&L) statement from scratch, work with real-world data to create an FMCG model, and discover the power of Pivot Tables for analyzing large datasets.
You’ll then explore the exciting world of company valuation.
You’ll learn how to calculate important metrics like Unlevered Free Cash Flow (UFCF), which shows how much cash a company has before paying its debts, and Weighted Average Cost of Capital (WACC), representing the average cost of financing a company’s assets.
You’ll build a complete Discounted Cash Flow (DCF) model, a widely used method to estimate a company’s value, and learn how to use it to value a real company, “Cheeseco.”
You’ll also explore how companies merge and acquire each other and understand how this relates to company valuation.
Also check our posts on:
