Excel is a powerful tool that can help you analyze data, create reports, and automate tasks.
It’s an essential skill for anyone working in business, finance, or data analysis.
By learning Excel, you can streamline your workflow, make more informed decisions, and gain a competitive advantage in the job market.
Finding a good Excel course on Coursera can be a challenge, with so many options available.
You’re looking for a program that’s comprehensive, engaging, and taught by experts, but also fits your learning style and goals.
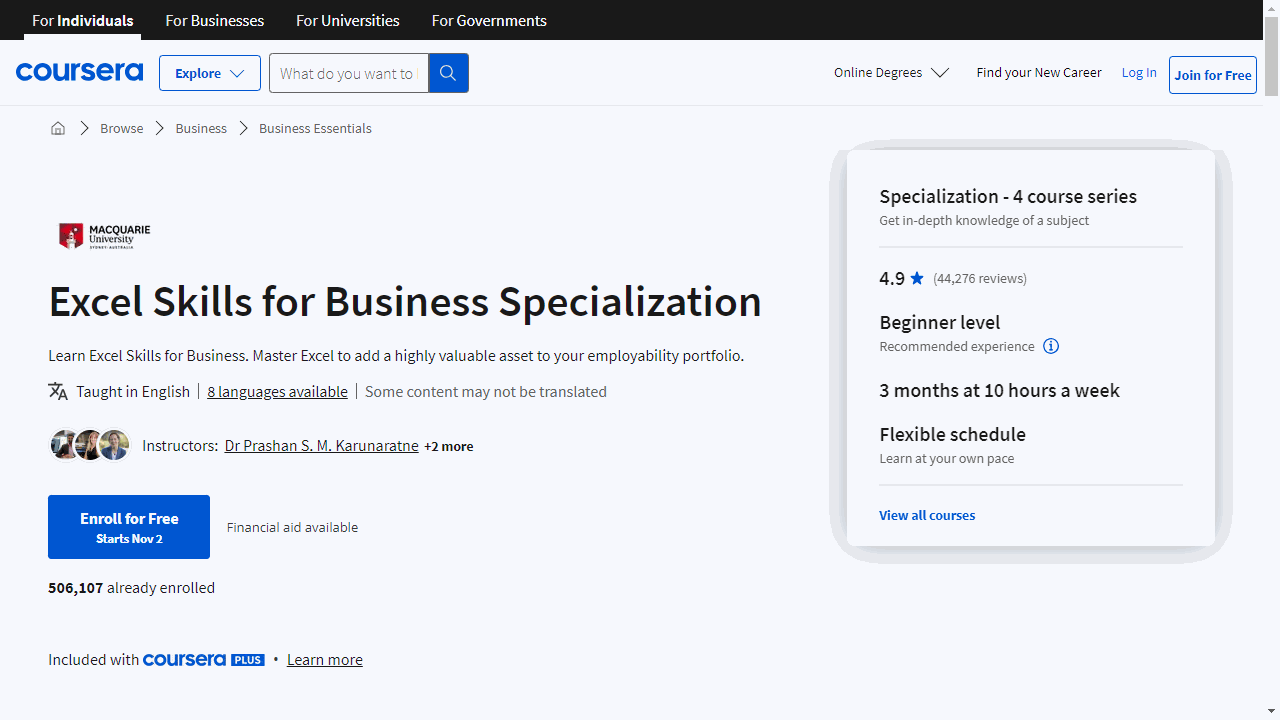
For the best Excel course overall on Coursera, we recommend the Excel Skills for Business Specialization by Macquarie University.
This specialization provides a comprehensive and practical learning experience, covering everything from basic Excel concepts to advanced techniques like data visualization and forecasting.
The course features interactive exercises, real-world case studies, and downloadable workbooks, making it an excellent choice for learners of all levels.
While this specialization is our top pick, there are other great options available on Coursera.
Keep reading for more recommendations for beginners, intermediate learners, and experts, as well as courses focusing on specific Excel skills and applications.
Excel Skills for Business Specialization
Starting with “Excel Skills for Business: Essentials,” you’ll learn to maneuver through the Excel interface, perform calculations, and present data through charts and graphs.
The course emphasizes practical application, offering you the chance to tackle real business problems with downloadable workbooks and full data sets.
Next, “Excel Skills for Business: Intermediate I” builds upon your foundational knowledge.
Here, you’ll learn to manage larger datasets and generate meaningful reports. The course introduces a layer of automation to streamline your tasks, saving you time and effort.
Through the narrative of Uma at PushPin, you’ll see these skills in action, making the learning process relatable and applicable.
As you progress to “Excel Skills for Business: Intermediate II,” the focus shifts to error prevention, advanced automation, and complex formulas.
These skills are crucial for informed decision-making and data forecasting. The course content is delivered with guidance from a team of instructors, ensuring you have support as you tackle more challenging concepts.
Lastly, “Excel Skills for Business: Advanced” is where you’ll polish your skills to a professional level.
This course covers advanced formula techniques, data preparation for analysis, and the creation of professional dashboards. You’ll have a comprehensive skill set that can significantly enhance your work quality and efficiency.
Each course in this specialization by Macquarie University is designed to be interactive and engaging, with a focus on real-world application.
By the end of the specialization, you’ll not only understand Excel better but also be able to leverage its features to improve your marketing, accounting, and operations.
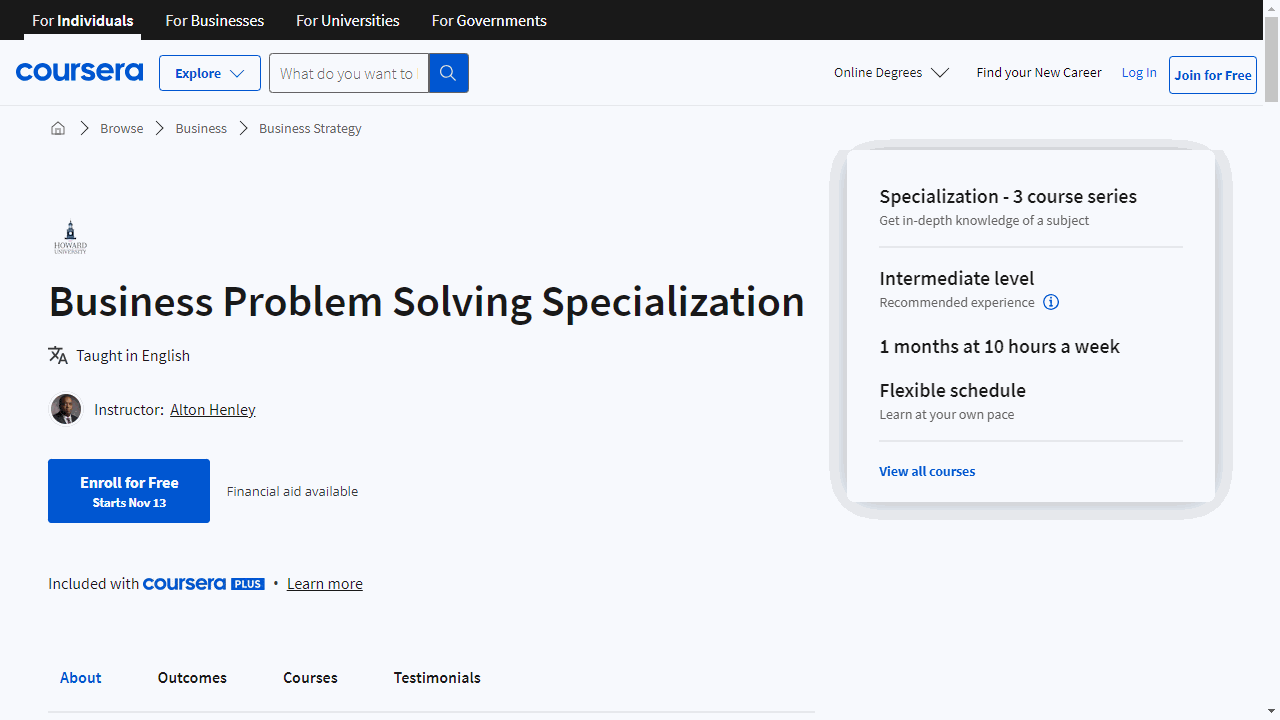
Business Problem Solving Specialization
Starting with “Fundamentals of Business Problem Solving,” this course is designed to sharpen your understanding of business processes.
You’ll learn to classify data effectively and build models to navigate complex business issues.
The course introduces you to Solver, a powerful Excel tool, enabling you to craft solutions and optimize business strategies.
By mastering spreadsheet manipulation and data interpretation, you’ll be equipped to analyze outcomes and inform decision-making.
Moving on to “Business Modeling Tools,” this course zeroes in on Excel’s Data Analysis toolkit.
You’ll delve into regression analysis, both single and multiple, to uncover patterns and predict trends.
This skill is crucial for constructing business cases and developing strategies that are informed by data.
Lastly, “Solving Business Problems with Spreadsheet Modeling” ties everything together with a practical capstone project.
Here, you’ll apply advanced data analysis techniques to real-world scenarios.
Learning to conduct Correlation and Sensitivity Analysis in Excel, you’ll gain insights into the relationships between variables and the impact of changes within your business model.
These courses stand out because they go beyond basic Excel training. They equip you with analytical skills that are highly sought after in the business world.
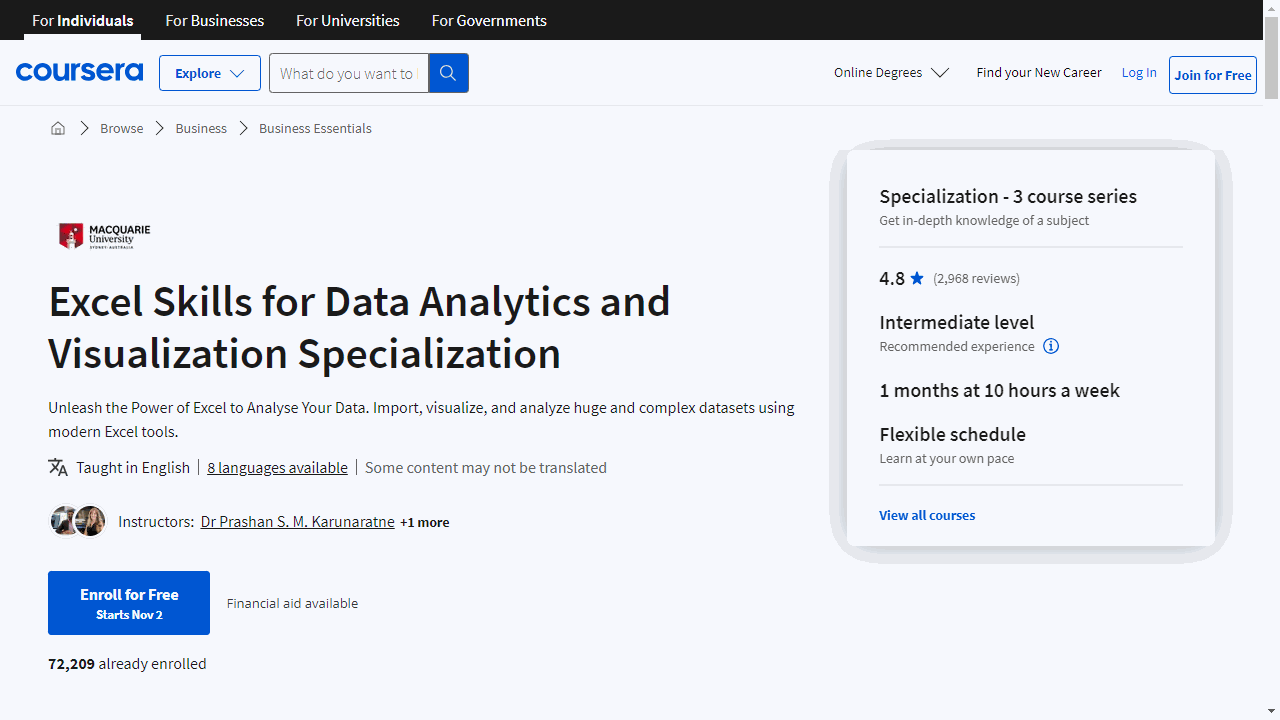
Excel Skills for Data Analytics and Visualization Specialization
This hands-on Specialization provides you with the fundamental Excel skills you need to analyze and visualize data effectively.
The first course, Excel Fundamentals for Data Analysis, teaches you Excel essentials like data cleansing tools and functions to prepare your data for analysis.
You’ll automate repetitive tasks through Named Ranges and Tables, transforming and linking data using logical and lookup functions.
These fundamentals will boost your efficiency and build a strong data analytics foundation.
To turn your cleaned data into impactful insights, the Data Visualization in Excel course shows you how to leverage Excel’s visualization tools.
You’ll move beyond basic charts to create visualizations like sparklines, conditional formatting, and even animated charts to find the right story for your data.
Specialized charts, pivot tables, and interactive dashboards take your analysis to the next level.
The third course, Excel Power Tools for Data Analysis, introduces you to Power Query for automating data imports and preparation.
Analyze large datasets with Power Pivot, using a modeling language called DAX right inside Excel.
Finally, you’ll be introduced to Power BI to build stunning interactive reports and dashboards to share your data narrative with others.
The courses build on each other, so you get a comprehensive understanding of the data analysis process from data prep to visualization and communication.
If you want to maximize your data insights using Excel, this Specialization will empower you with the tools and techniques you need.
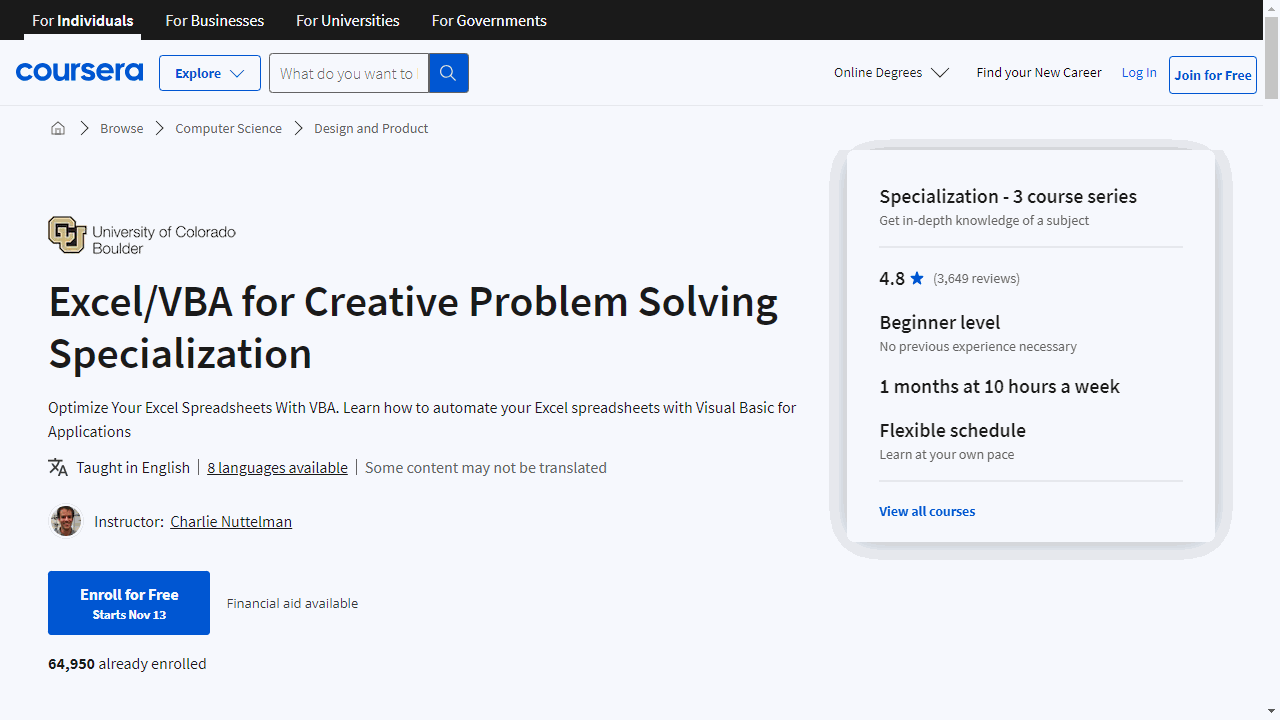
Excel/VBA for Creative Problem Solving Specialization
This specialization is designed to enhance your Excel capabilities by introducing you to the world of Visual Basic for Applications (VBA), a tool that can automate and customize your spreadsheets in ways you might not have imagined.
Starting with “Excel/VBA for Creative Problem Solving, Part 1,” you’ll learn to automate routine tasks by creating macros, which can save you a significant amount of time.
The course also covers how to craft user-defined functions, giving you the power to tailor Excel’s functionality to your specific needs.
VBA might seem daunting at first, but its intuitive nature makes it accessible even to those new to programming.
The course’s structure is practical, with each module presenting you with real-world inspired problems.
This approach ensures that the skills you acquire are not only theoretical but also applicable to everyday tasks.
The in-application assignments mean you’ll be practicing directly in Excel, reinforcing your learning through experience.
As you move on to “Excel/VBA for Creative Problem Solving, Part 2,” you’ll build on your foundation.
This course delves into more complex topics like managing arrays and text strings, and automating data consolidation from multiple sources.
You’ll also learn to create sophisticated user forms, which can elevate the way you interact with data and present your work.
Finally, “Excel/VBA for Creative Problem Solving, Part 3 (Projects)” offers a project-based learning experience where you can apply your skills to solve open-ended problems.
This course encourages creative thinking and problem-solving, and the peer review component provides valuable feedback and alternative perspectives on your approach.
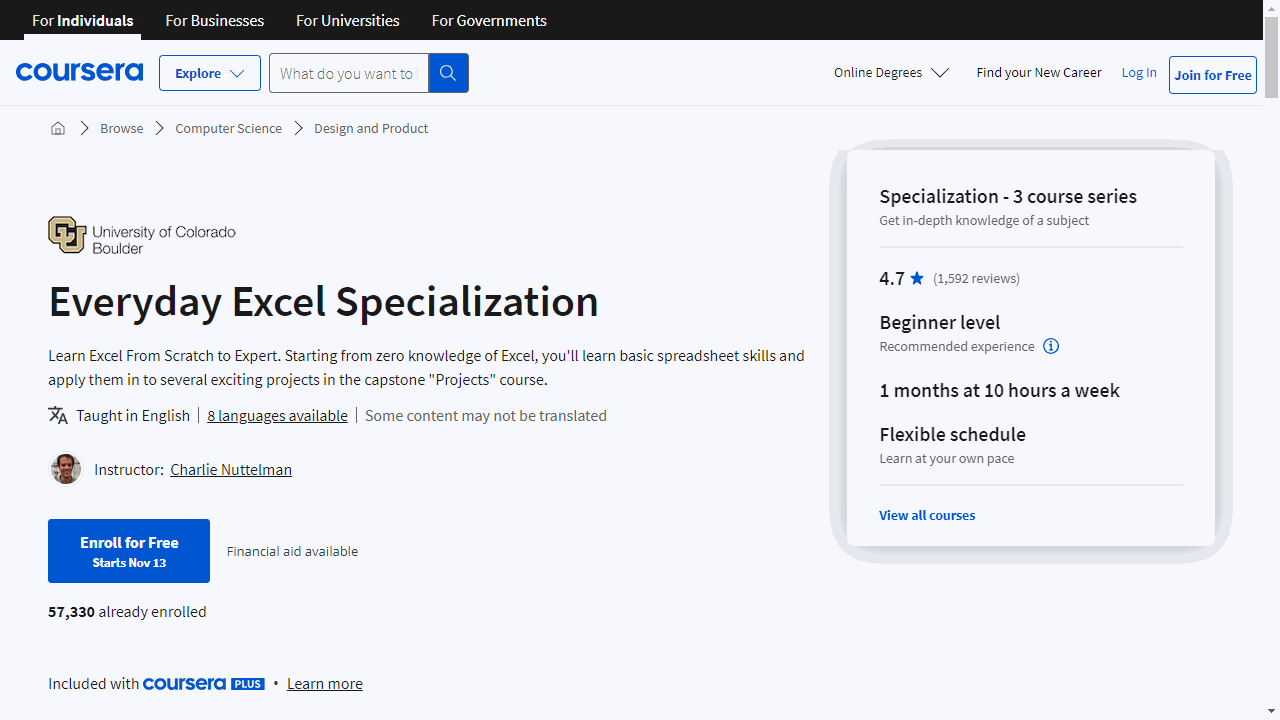
Everyday Excel Specialization
If you’re searching for a comprehensive Excel course that caters to all skill levels, the “Everyday Excel Specialization” on Coursera stands out for its structured learning path and practical application.
Starting with “Everyday Excel, Part 1,” you’re introduced to Excel’s environment in a way that’s accessible and straightforward.
This course is designed to build a solid foundation, teaching you not only how to navigate Excel but also how to perform essential functions that are useful in everyday tasks.
You’ll learn to manage and format data, create basic charts, and use functions that are applicable to real-life scenarios.
The interactive nature of the course, with in-application assignments, ensures that you’re not just passively absorbing information but actively engaging with the material.
Progressing to “Everyday Excel, Part 2,” the curriculum builds on what you’ve learned, introducing more sophisticated techniques.
This course is perfect for those who have a grasp of the basics and are ready to delve into advanced data management and financial calculations.
The inclusion of tools like Data Tables, Goal Seek, and Solver opens up new possibilities for data analysis, allowing you to conduct ‘what-if’ scenarios and make informed decisions based on your findings.
The specialization culminates with “Everyday Excel, Part 3 (Projects),” a capstone course that challenges you to apply your accumulated knowledge to complex, real-world projects.
This course is particularly engaging because it offers a range of projects to suit diverse interests, ensuring that you can find something that resonates with your personal or professional goals.
It’s an opportunity to solidify your skills and demonstrate your ability to use Excel in practical, impactful ways.
Each course within the specialization is thoughtfully crafted to be engaging and challenging, with a mix of quizzes and hands-on assignments that reinforce learning.
The progression from beginner to advanced topics is smooth, with each new skill building on the last.
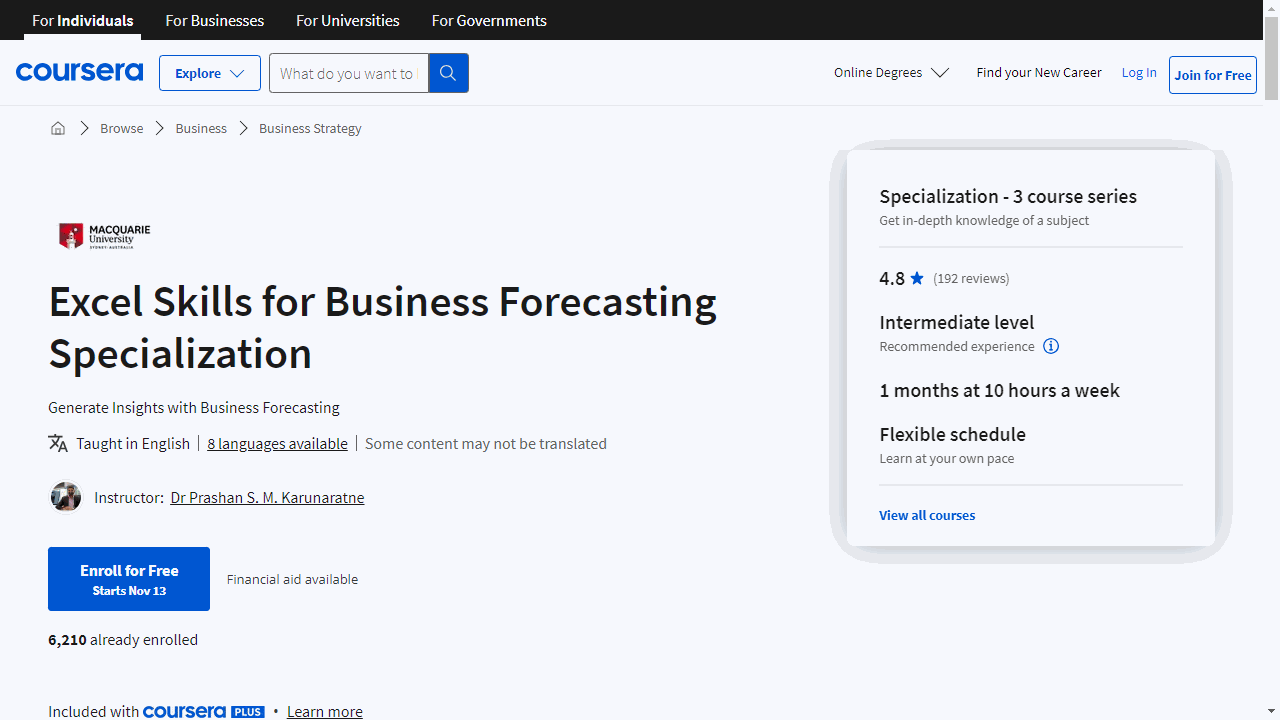
Excel Skills for Business Forecasting Specialization
If you want to enhance your Excel proficiency with a focus on business forecasting, this specialization equips you with the tools and techniques necessary to analyze and predict business trends effectively.
The specialization begins with “Excel Time Series Models for Business Forecasting,” where you delve into various forecasting methods tailored to different data behaviors.
You’ll learn to interpret and manipulate time series data, applying theoretical concepts directly within Excel.
The course emphasizes practical application, teaching you to build models, graphically represent data, and refine forecasts for accuracy.
You’ll leave with the ability to discern which model best aligns with your business objectives.
Moving forward, “Excel Regression Models for Business Forecasting” introduces you to the causal relationships within your business data.
This course expands your analytical toolkit, covering a range of regression models from simple to multiple, and even autoregressions.
You’ll explore how to identify influential variables and use these insights for forward planning.
The course is designed to help you understand the nuances of each model and apply them to generate actionable business intelligence.
Lastly, “Judgmental Business Forecasting in Excel” complements quantitative techniques with a qualitative approach.
This course acknowledges the limitations of numerical data and guides you through judgmental forecasting methods.
You’ll learn to incorporate business indicators and subjective assessments into your forecasts, using Excel to visualize outcomes.
The course also addresses the impact of biases, ensuring you maintain objectivity in your predictions.
You’ll gain not just a set of Excel skills, but also a strategic approach to business forecasting.
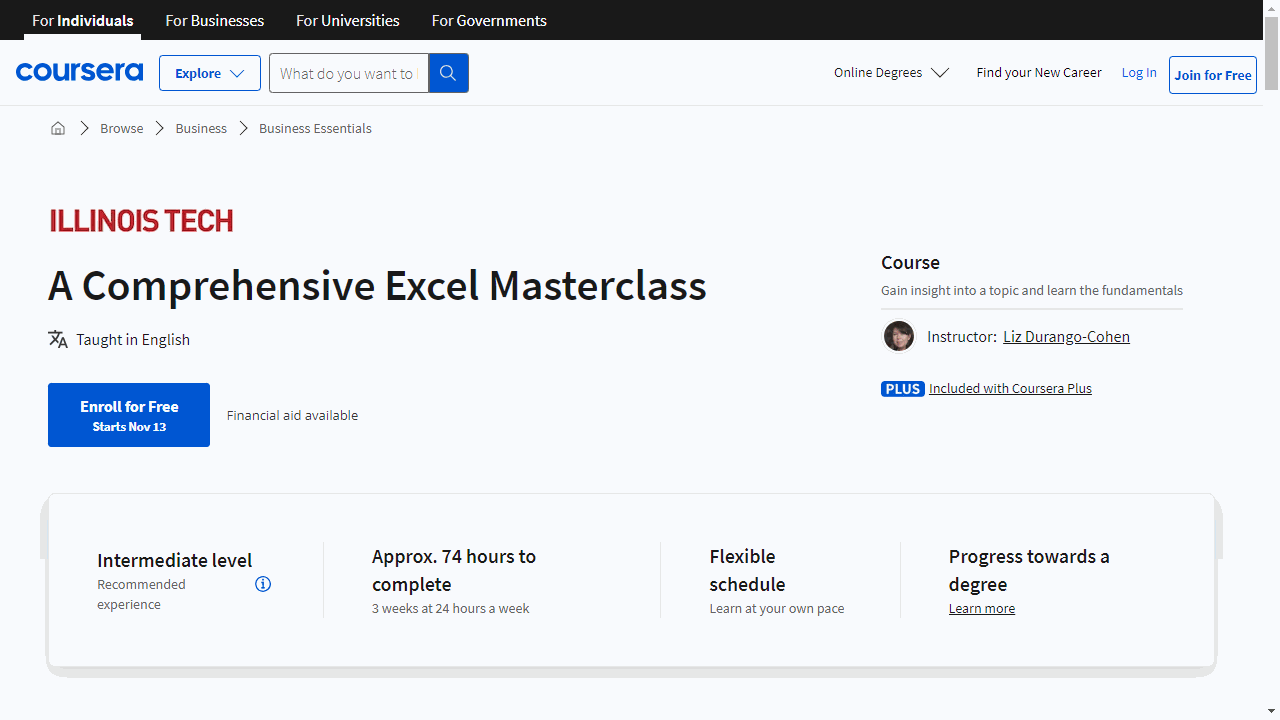
A Comprehensive Excel Masterclass
The course begins with a solid foundation in financial concepts, such as the Time Value of Money and Cash Flow Diagrams, crucial for anyone dealing with finances.
You’ll learn to differentiate between simple and compound interest and understand the implications of nominal versus effective rates—all through practical Excel functions.
As you progress, the course introduces Excel’s financial functions like FV, PV, RATE, and NPER.
These aren’t just acronyms; they’re tools that will enable you to handle financial calculations with confidence.
You’ll also tackle loan payments and amortization schedules, learning to create and interpret them effectively.
Pivot Tables are another highlight of this course. You’ll discover how to manipulate and analyze data, turning overwhelming tables into insightful reports.
The course demystifies complex features, teaching you to use “Show Value As” options for deeper data analysis.
Then there’s XLOOKUP, a game-changer for those familiar with VLOOKUP’s limitations.
This function, along with Google Sheets insights, ensures you’re equipped for data tasks across different platforms.
The masterclass truly shines when it comes to dashboards.
You’ll learn to design and create dynamic, interactive dashboards that not only look professional but also tell a compelling story with your data.
The course covers everything from form controls to slicers and timelines, ensuring your reports are both informative and engaging.
This course is designed with clarity in mind, avoiding jargon and unnecessary complexity.
It’s suitable for anyone looking to enhance their Excel skills, whether for professional development or personal finance management.
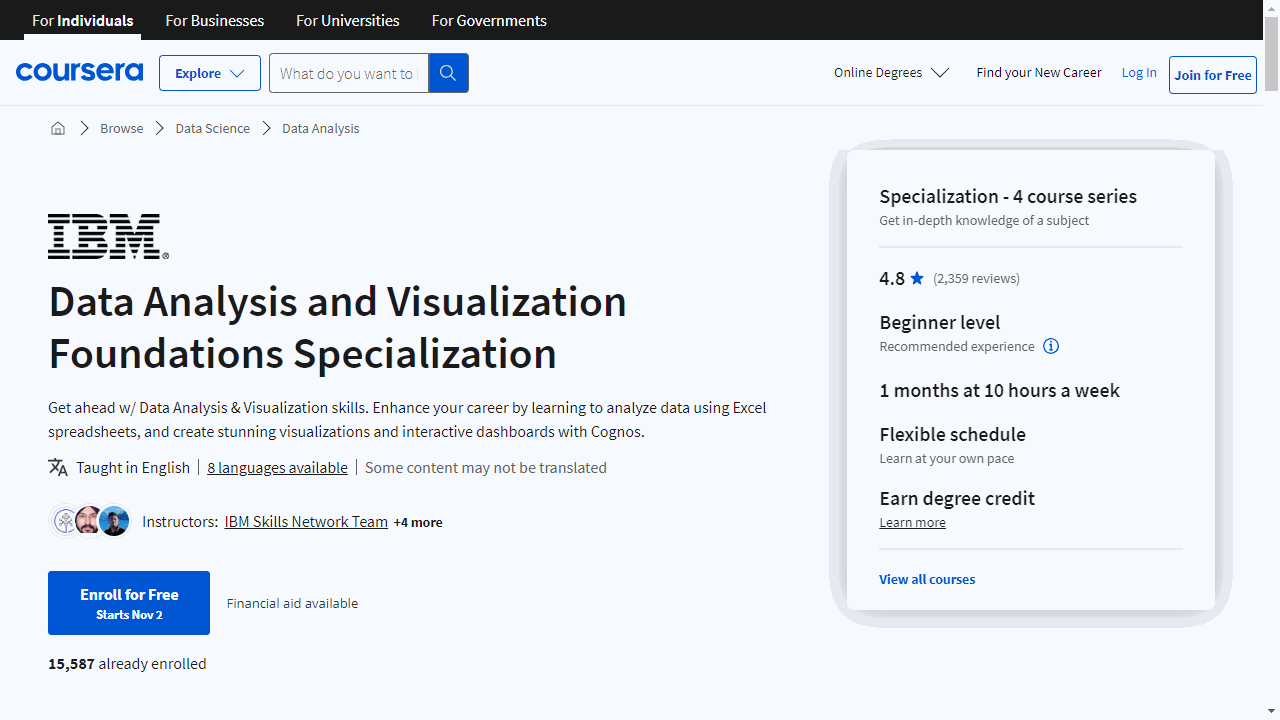
Data Analysis and Visualization Foundations Specialization
In this specialization, you’ll start with a gentle overview of data analysis and the data ecosystem, learning the difference between roles like Data Analyst, Data Scientist, and Data Engineer.
The first course covers the basics, walking you through key steps like gathering, cleaning, analyzing, and visualizing data.
You’ll also get exposure to essential big data tools like Hadoop and Spark. By the end, you’ll have completed a real-world data analysis scenario to practice your new skills.
From there, the Excel course provides hands-on data wrangling experience - no coding required.
You’ll gain proficiency in Excel by importing, formatting, and manipulating data. Key features like filtering, sorting, and pivot tables will transform scattered data into organized, readable information.
The final course brings together Excel and IBM Cognos Analytics to build interactive dashboards.
You’ll create simple charts like line and bar graphs before moving on to advanced visualizations like Treemaps and Sparklines. An Excel dashboard project lets you showcase these in-demand skills.
With a mix of video lessons and hands-on practice, this Specialization will give you a solid base in Excel, Cognos, and fundamental analysis skills to start a data analytics career.
The courses are aimed at beginners with no prior experience needed. By the end, you’ll have marketable abilities and a portfolio to show employers.
