
Power BI is a powerful business intelligence and data visualization tool developed by Microsoft.
It allows users to connect to various data sources, transform and analyze data, and create interactive reports and dashboards to gain insights and make data-driven decisions.
Learning Power BI can open up a world of opportunities in data analysis, business intelligence, and data visualization across various industries.
Whether you’re a business analyst, data scientist, or simply someone who wants to make better use of data, mastering Power BI can significantly enhance your skillset and career prospects.
Finding the right Power BI course can be a challenge, especially with the abundance of options available online.
You want a course that not only covers the fundamentals but also delves into advanced concepts, provides hands-on practice, and is taught by experienced instructors who can guide you through the intricacies of the tool.
You’re looking for a course that will equip you with the skills and knowledge needed to confidently use Power BI in real-world scenarios.
Based on our research and analysis, we believe that the Microsoft Power BI Desktop for Business Intelligence course on Udemy is the best overall choice for anyone looking to learn Power BI.
This comprehensive course starts with the basics and gradually progresses to advanced topics, covering everything from data modeling and DAX to creating stunning visualizations and interactive dashboards.
The instructor’s clear explanations, practical examples, and engaging teaching style make it an excellent choice for both beginners and those with some prior experience.
However, this is just one of the many excellent Power BI courses available.
We understand that everyone has different learning styles and preferences, so we’ve compiled a list of other top-rated courses that cater to various needs and skill levels.
Whether you’re a beginner or an experienced data professional, you’re sure to find a course that fits your requirements.
Keep reading to explore our other recommendations and discover the perfect Power BI course to embark on your data visualization journey.
Microsoft Power BI Desktop for Business Intelligence

Provider: Udemy
This Microsoft Power BI Desktop course begins with the fundamentals.
You will explore the Power BI Desktop interface and discover how it simplifies data analysis.
You’ll then learn to connect to various data sources, like databases and web pages, extracting valuable insights from diverse platforms.
The course emphasizes the power of Power Query, enabling you to transform and clean data, ensuring accuracy in your analyses.
The journey continues with data modeling, a crucial aspect of business intelligence.
You’ll learn to establish relationships between tables, ensuring data integrity and a seamless flow of information.
The course introduces DAX (Data Analysis Expressions), a powerful language that empowers you to create sophisticated calculations and measures, going beyond basic reporting to unlock deeper insights.
Finally, you’ll transform data into compelling visuals.
You’ll master various chart types, filters, slicers, and even custom visuals, creating interactive dashboards that tell a story.
You’ll explore AI capabilities like anomaly detection and smart narratives, revealing hidden patterns and trends.
The course also covers Power BI optimization tools, enabling you to create efficient and high-performing reports.
You’ll even work on Maven Market, a real-world project, applying your knowledge to a practical scenario.
Microsoft Power BI Data Analyst Professional Certificate
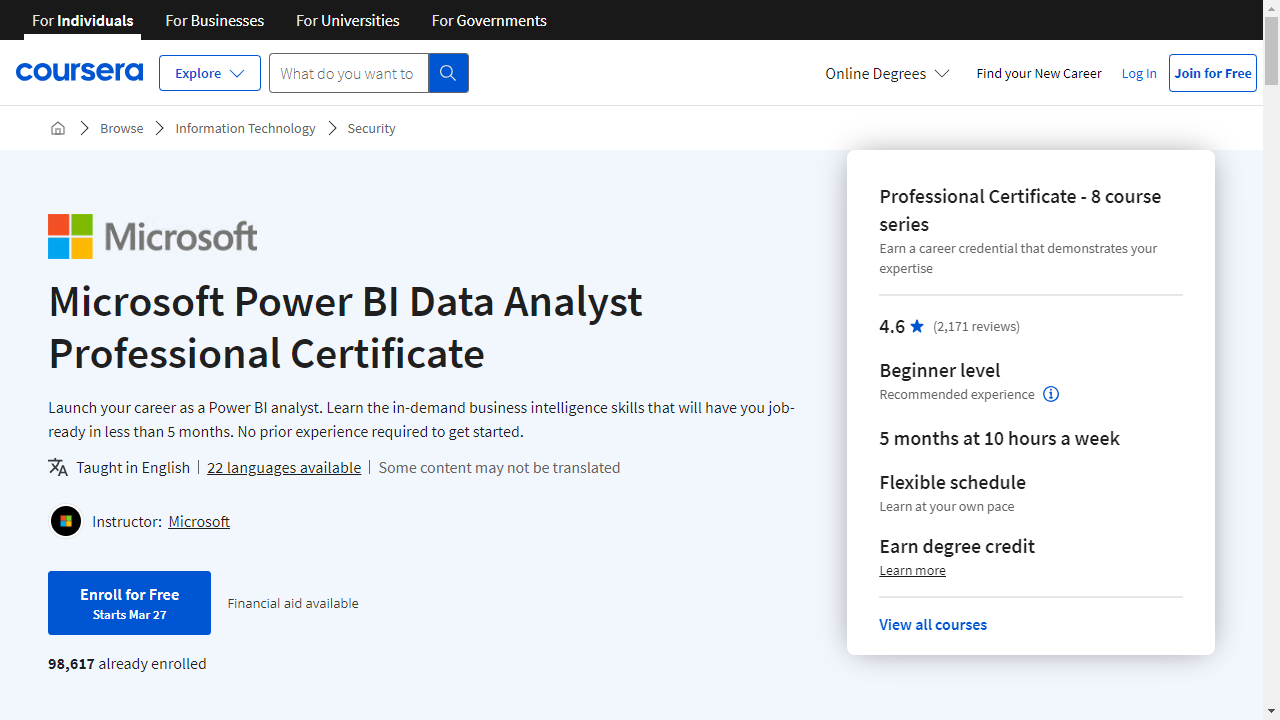
Provider: Coursera
The Microsoft Power BI Data Analyst Professional Certificate on Coursera equips you with the skills needed to excel in data analysis using Microsoft Power BI.
You will begin by mastering Microsoft Excel, learning to prepare data for analysis through formulas and functions.
This foundation in Excel will seamlessly transition you to the world of Power BI.
You will then delve into the role of a data analyst, gaining a comprehensive understanding of the data analysis process and the essential skills and tools required.
This includes mastering the Extract, Transform, and Load (ETL) process, where you will learn to collect data from various sources, clean and prepare it using Power Query, and ensure its integrity.
The course then guides you through the intricacies of data modeling in Power BI.
You will learn to create and manage relationships in data models, utilize the Star Schema, and harness the power of DAX to add insightful calculations.
This knowledge will empower you to design visually stunning and informative reports and dashboards, complete with interactive navigation and advanced analytics capabilities.
Finally, you will learn to deploy and maintain Power BI assets, including creating and publishing apps, implementing security measures and monitoring systems, and establishing Row Level Security.
The program culminates in a capstone project and a dedicated course to help you ace the Microsoft PL-300 exam, paving the way for you to earn the globally recognized Microsoft Power BI Data Analyst certification.
Microsoft Power BI - The Practical Guide 2024

Provider: Udemy
In this Power BI course, you will embark on a journey to master the art of creating insightful dashboards and reports.
The journey begins with the fundamentals of Power BI Desktop, where you will familiarize yourself with its intuitive interface and grasp the essential workflow of a typical project.
As you progress, you will dive into the realm of data preparation using the powerful Power Query Editor.
Here, you will connect to various data sources, such as CSV and Excel files, cleanse your data, and learn essential techniques like filtering, sorting, and grouping to shape your data effectively.
The course then guides you through the intricacies of data transformation, where you will learn to create robust data models based on the star schema.
You will delve into the world of DAX (Data Analysis Expressions), understanding its differences from the M-language and mastering the use of DAX functions for creating calculated columns and measures to extract meaningful insights from your data.
You will also explore various relationship types, including one-to-many, many-to-many, and one-to-one, and how to leverage them effectively in your data model.
With a solid foundation in data modeling, you will transition to the creative realm of designing visually appealing and interactive reports using the Report View.
The course will introduce you to a diverse range of visualizations, including line charts, column charts, and treemaps.
You’ll discover how to use slicers to create interactive filters, master the art of conditional formatting to highlight key data points, and understand how to create engaging reports with features like drill-down functionality and hierarchical breakdowns.
This Power BI course goes beyond the desktop, teaching you how to share your insights with the world.
You will explore Power BI Pro, learning to publish your meticulously crafted reports and collaborate with colleagues on workspaces.
The course will also guide you through creating apps, enabling you to share your reports seamlessly with a wider audience.
Additionally, you will learn about gateways and how they can help you keep your data fresh and up-to-date.
Finally, you will gain valuable insights on staying ahead of the curve by exploring helpful resources and learning how to leverage Power BI’s preview features.
Data Storytelling with Power BI
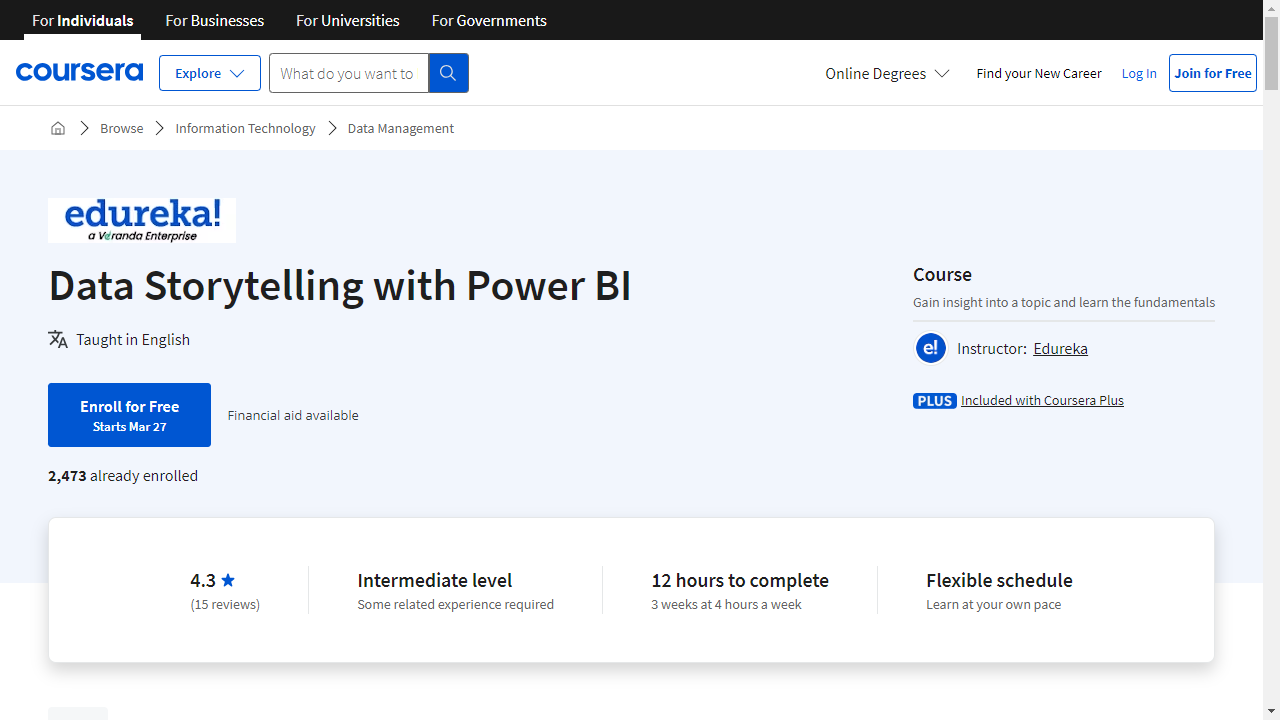
Provider: Coursera
This Power BI course takes you from the ground level to confidently using Power BI.
You start by installing Power BI Desktop and Service, exploring their interfaces, and discovering how to connect to various data sources.
You then learn how to prepare your data for analysis by transforming and cleaning it, ensuring its accuracy and usefulness.
A practical project analyzing San Francisco’s call records helps you apply these techniques.
The course then introduces you to DAX, Power BI’s powerful data analysis language.
You learn to write DAX queries to manipulate and analyze your data, gaining a deep understanding of its capabilities.
You’ll practice your DAX skills through projects like analyzing railway data and managing tables, solidifying your grasp of this essential tool.
You then dive into the world of data visualization, learning to create informative and visually engaging charts and graphs using Power BI’s tools.
You’ll discover how to arrange and manage these visuals to craft compelling reports that tell a story with your data, practicing with projects that involve visualizing Netflix data and creating insightful sales reports.
Finally, you explore Power BI Service, the cloud-based platform where you can share your reports and collaborate with others.
You learn to publish reports, build dashboards, and even leverage AI for deeper insights.
The course culminates in a final project where you analyze employee attrition data, creating a compelling data story that demonstrates your mastery of Power BI.
Complete Introduction to Microsoft Power BI

Provider: Udemy
This Power BI course begins by familiarizing you with the Power BI Service, which you’ll use to access and share your work.
You’ll then explore the Power BI Desktop, the main tool for crafting reports and dashboards.
You quickly dive into creating visually appealing reports, learning how to format and style your data presentations.
The course guides you through using various data visualizations like bar graphs, line graphs, and scatterplots.
You’ll master filtering data to focus on specific areas and discover how to build interactive dashboards that bring your insights to life.
As you progress, you’ll delve into the world of DAX (Data Analysis Expressions), a formula language used within Power BI.
You’ll learn to create custom calculations and metrics by writing DAX formulas to generate calculated columns and measures.
The course also introduces you to the Power BI Query Editor, a robust tool for cleaning and transforming your data before visualization.
You’ll discover how to connect and leverage the combined strengths of Power BI and Excel.
This connection allows you to analyze data seamlessly between these powerful tools.
A key highlight of the course is a case study on the Corona Virus pandemic.
This real-world example teaches you to use Power BI to analyze data from the World Health Organization (WHO).
You’ll work through the process of creating a dashboard to visualize pandemic data and discover how to share your findings effectively.
By the time you finish this course, you’ll confidently create compelling and informative Power BI reports and dashboards.
Insights of Power BI
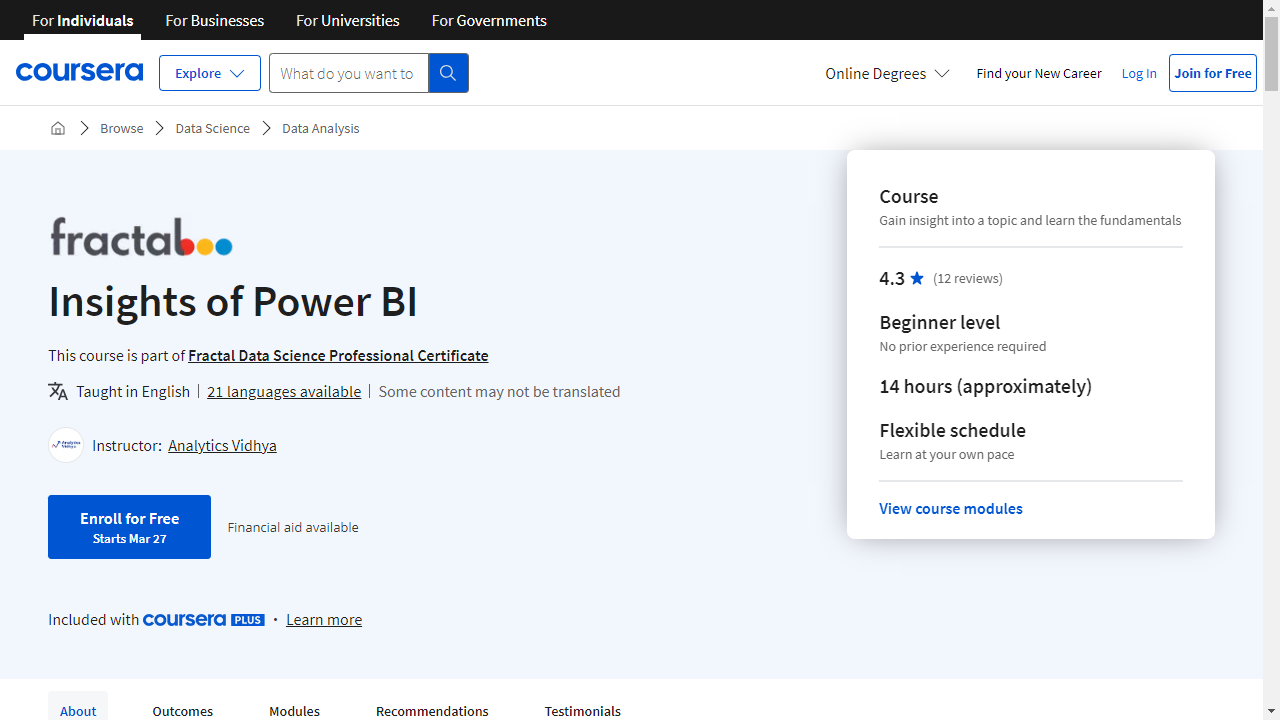
Provider: Coursera
This “Insights of Power BI” course guides you from the basics of Power BI to building insightful dashboards.
You begin with the Power BI interface, mastering charts and graphs before diving into data cleaning, a crucial skill for accurate analysis.
The course then introduces DAX, a powerful language for complex calculations.
You learn to build calculated columns and measures, essential for extracting meaningful insights from raw data.
You explore different types of DAX functions, including text functions for manipulating strings, logical functions for building complex conditions, and filter functions like CALCULATE and FILTER for advanced data analysis.
You discover time intelligence functions to analyze trends and patterns in your data over time.
Through hands-on exercises, you apply these skills to a real-world project, building a sales and marketing dashboard.
You learn to connect different data sources, analyze marketing spend, track web traffic through metrics like click-through rates, and ultimately gain a comprehensive view of sales and marketing performance.
This practical experience solidifies your understanding of Power BI, enabling you to transform data into actionable insights for informed decision-making.
Power BI A-Z: Hands-On Power BI Training For Data Science!

Provider: Udemy
This one starts you off strong by teaching you how to install Power BI and connect to data.
You’ll jump right into creating your first bar chart, mastering techniques like drilling through data hierarchies, adding colors for clarity, and creating calculated columns for deeper analysis.
As you progress, you’ll tackle timeseries data, learning how to aggregate and filter information to create insightful area charts and highlight key trends.
The course then guides you through more advanced topics like creating maps and scatterplots, teaching you how to join data from different sources using various methods, including LEFT, RIGHT, INNER, and OUTER joins.
You’ll understand the difference between calculated columns and measures – a key concept in Power BI – and use this knowledge to build compelling visualizations.
Finally, you’ll bring everything together by creating an interactive business intelligence report.
This section teaches you how to incorporate geographic data, create insightful table calculations, and design dynamic dashboards with features like treemaps and custom visuals.
Data-Driven Decisions with Power BI
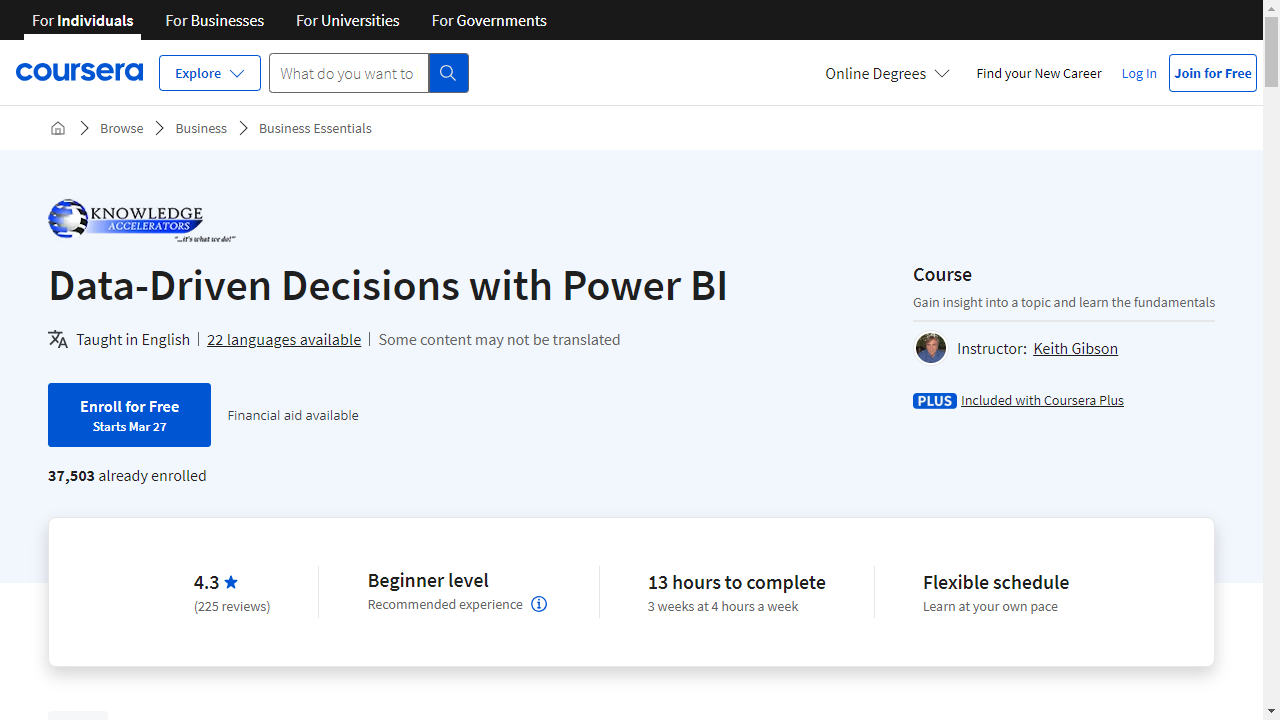
Provider: Coursera
This Power BI course equips you with the skills to transform data into informed decisions.
You begin by grasping the fundamentals of Power BI, including licensing options and data connection methods, practicing with sample datasets from the get-go.
You’ll master importing data from various sources like files and websites, and even connect to databases using the “Get Data” feature.
You then transition into the heart of data analysis, exploring the Data View for cleaning and transforming your data.
You’ll learn to manipulate data effectively, performing calculations, rounding values, and handling errors using the Power Query Editor.
The course then guides you through the Model View, where you’ll build relationships between tables, edit existing ones, and add new connections for a comprehensive data model.
The course then unveils the power of the Report View.
Here, you’ll create insightful visualizations like scatter charts, funnel charts, gauge charts, and ribbon charts, customizing their appearance and analytical features to effectively communicate data insights.
You’ll even work with map visualizations to explore geographical data.
You’ll discover how to build Q&A visualizations, allowing you to pose questions in natural language and receive instant visual answers.
Finally, you’ll dive into Power BI Service to manage your workspaces, publish reports, and collaborate with others.
You’ll explore integrating Power BI with other Microsoft tools, embedding reports in Microsoft Teams channels and SharePoint Online.
This integration allows you to share your insights effortlessly, facilitating data-driven decisions across your organization.
Also check our posts on: