Power BI is a powerful business intelligence tool that allows you to analyze data, create interactive visualizations, and share insights with others.
It’s a valuable skill to learn if you want to work in data analysis, business intelligence, or any field where data-driven decision making is essential.
By learning Power BI, you can gain insights from your data, create compelling reports and dashboards, and make better business decisions.
Finding the right Power BI course on Coursera can be difficult.
You want a program that’s comprehensive, engaging, and taught by experts.
You also want something that will prepare you for a career in data analytics.
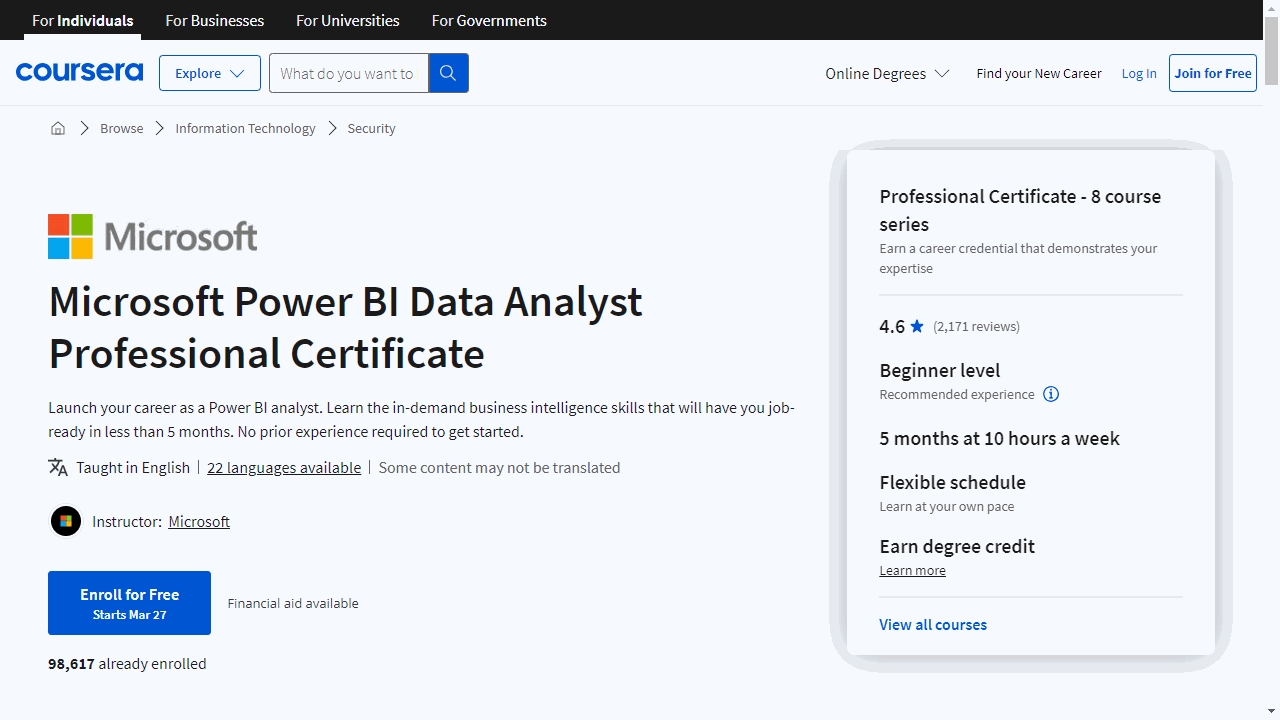
For the best Power BI course overall on Coursera, we recommend the Microsoft Power BI Data Analyst Professional Certificate.
This comprehensive program is designed to equip you with the skills needed for a career in data analysis using Power BI.
It covers data preparation, data modeling, data visualization, and reporting, and includes hands-on projects to help you practice your skills.
This is just one of many great Power BI courses on Coursera.
Keep reading for other recommendations based on your learning style, goals, and experience level.
Microsoft Power BI Data Analyst Professional Certificate
This comprehensive program consists of several courses that provide a solid foundation for a career in data analysis using Microsoft Power BI.
The journey begins with “Preparing Data for Analysis with Microsoft Excel,” where you’ll learn to create and prepare data for analysis using Excel’s formulas and functions.
This course equips you with the essential skills needed for data preparation, a crucial step in the data analysis process.
Next, “Harnessing the Power of Data with Power BI” introduces you to the role of a data analyst and the key stages involved in data analysis, with a focus on applying them using Power BI.
You’ll gain an understanding of how data is gathered, the importance of data-driven decisions, and the components of Power BI.
In “Extract, Transform and Load Data in Power BI,” you’ll dive into the ETL process, learning how to collect data from multiple sources, clean and transform it using Power Query, and ensure data integrity.
This course is essential for preparing data for modeling.
The “Data Modeling in Power BI” course teaches you how to create and maintain relationships in a data model, form a model using a Star Schema, and write calculations in DAX (Power BI’s expression language) to create elements and perform analysis.
You’ll also learn to optimize performance in your Power BI model.
“Data Analysis and Visualization with Power BI” focuses on report design, formatting, and navigation techniques to tell compelling data-driven stories.
You’ll explore different visualization types, learn to perform data analysis using visualizations, and design accessible reports and dashboards.
In “Creative Designing in Power BI,” you’ll learn how to create cohesive and audience-focused business intelligence reports and dashboards.
You’ll work with specialist chart visualizations and add elements like videos, streaming data, and QR codes to enhance your dashboards.
The “Deploy and Maintain Power BI Assets and Capstone Project” course covers deploying and managing Power BI workspaces, implementing security and monitoring, and creating dynamic reports.
You’ll also complete a capstone project to showcase your newly acquired Power BI and data analysis skills.
Finally, “Microsoft PL-300 Exam Preparation and Practice” helps you prepare for the Microsoft PL-300 exam, which, upon passing, earns you the Microsoft Power BI Data Analyst certification – a globally recognized credential validating your real-world skills.
Throughout the program, you’ll gain hands-on experience with key Power BI features, including data modeling, DAX, Power Query, data visualization, and report design, equipping you with the skills needed to become a proficient Power BI data analyst.
Data Storytelling with Power BI
This course is designed to give you a thorough understanding of Power BI’s capabilities, coupled with the skills to craft compelling data narratives.
Starting with the essentials, you’ll learn what Power BI is, its applications, and how to set it up on your desktop and online.
The course is practical, with a focus on hands-on learning.
You’ll familiarize yourself with the Power BI interfaces and dive into data sources, learning to transform and clean data effectively.
Real-world practice projects are a core part of the curriculum, challenging you to apply your skills to scenarios like analyzing city call records and railway operations.
These projects simulate the data storytelling process from start to finish.
Technical skills are central to this course.
You’ll delve into DAX, starting with basic queries and advancing to complex functions.
This knowledge will empower you to manipulate data with precision, giving you the control needed to uncover deeper insights.
Visualization is another key topic.
You’ll explore various visualization types and learn to create and manage them, turning raw data into visual stories that can reveal hidden trends and insights.
The course also covers the Power BI Service, teaching you to load data, create reports, and use AI insights.
Your final project will involve creating a data story on employee attrition, encapsulating all the skills you’ve learned.
By the end of this course, you’ll not only be proficient in Power BI but also adept at using data to tell stories that can inform and persuade.
Insights of Power BI
This course is structured to ease you into the world of data visualization, starting with the essentials and gradually building up to more complex concepts.
You’ll begin by familiarizing yourself with the Power BI interface, learning to navigate its features with ease.
The course meticulously covers a wide array of charts and graphs, ensuring you understand each type before progressing.
Practical application is key, and you’ll get your hands dirty by constructing your own dashboards.
This isn’t just about theory; it’s about applying what you learn to create something tangible and useful.
Data cleaning, often overlooked, is given its due importance here.
You’ll delve into why it’s critical and how to conduct preliminary data investigations.
The course also demystifies relationships between tables and the data model, empowering you with the knowledge to handle complex data sets.
DAX functions can intimidate beginners, but this course simplifies them.
You’ll explore calculated columns, measures, and contexts, learning to manipulate data effectively.
The course also covers various DAX functions, including aggregation, logical, text, and filter functions, equipping you with a versatile analytical toolkit.
Real-world scenarios bring the lessons home, as you’ll analyze sales, revenue, and online metrics, gaining insights into how data drives business decisions.
The course culminates in building a comprehensive sales and marketing dashboard, a project that encapsulates all the skills you’ve acquired.
Data-Driven Decisions with Power BI
From the get-go, you’ll familiarize yourself with the Power BI environment, including its various licenses, ensuring you’re well-equipped to navigate the platform’s offerings.
The course kicks off by teaching you to import and connect to data from multiple sources.
This foundational skill is critical as it sets the stage for all the advanced analysis you’ll do later.
You’ll also get hands-on experience with sample datasets, allowing you to practice without the pressure of using real-world data.
As you progress, the Power Query Editor becomes your ally in data preparation.
You’ll learn to clean data, perform basic math operations, and handle errors, which are essential steps before any serious analysis can take place.
The course emphasizes practical application, encouraging you to build your own Power BI report early on, reinforcing your learning through real-world application.
Data modeling and visualization are at the core of week two.
You’ll delve into the Model View to understand and manipulate data relationships, a skill that’s crucial for accurate analysis.
The Report View section empowers you to create and format various visualizations, from tables to KPI charts, ensuring your reports are both informative and visually appealing.
The course doesn’t just stop at static charts; it introduces dynamic visualizations like scatter, waterfall, gauge, and funnel charts, enhancing your ability to present data in engaging ways.
Geospatial mapping further expands your toolkit, allowing you to incorporate location data into your analysis.
By the third week, you’re transforming questions into visual answers, using advanced features like Q&A visualizations.
You’ll refine your reports with slicers and filters, and learn to drill down into data for deeper insights.
Publishing your reports becomes second nature, enabling you to share your findings with stakeholders effectively.
The final leg of the course focuses on Power BI Service, where you’ll manage workspaces, create dashboards, and explore integration with Microsoft Teams and SharePoint for seamless collaboration.
The course ensures you’re not just learning in isolation but are prepared to share and act on your insights.
Throughout the course, regular check-ins and practical exercises keep your learning on track.
By the end, you’ll have a comprehensive understanding of Power BI, equipped with the skills to make data-driven decisions confidently.
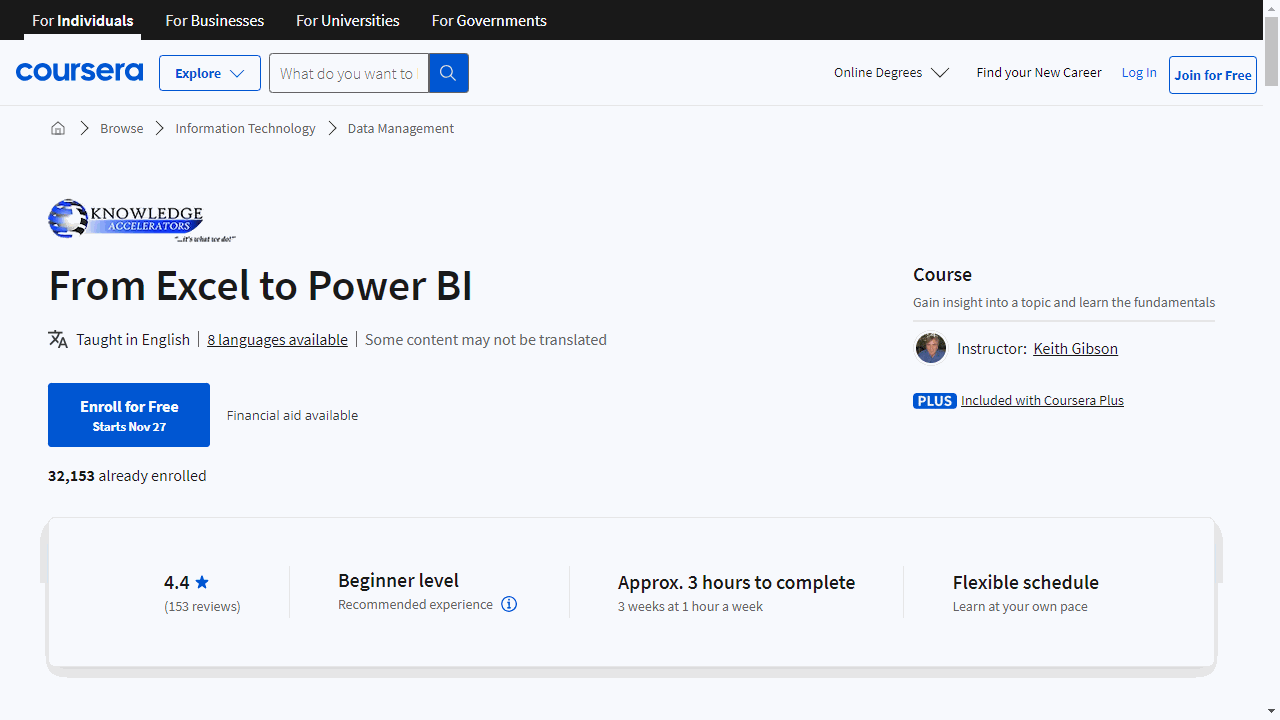
From Excel to Power BI
The course begins with an essential overview of Power BI, including a breakdown of licenses, ensuring you start on the right foot without unnecessary expenses.
The course then guides you through importing and preparing your data, a foundational skill for any analyst.
You’ll master the Power Query Editor, where you’ll learn to clean and refine your datasets, a critical step for accurate analysis.
Data modeling is next, where Power BI truly shines.
You’ll discover how to create relationships between tables, enabling complex data analysis that goes beyond Excel’s capabilities.
Visual storytelling is at the heart of Power BI, and this course doesn’t skimp on that.
You’ll learn to craft compelling visualizations in the Report View, using text and chart visuals like KPIs, scatter, and waterfall charts to make your data speak volumes.
Interactivity is key in data analysis, and with lessons on filters, slicers, and drilling techniques, you’ll gain the skills to explore your data dynamically, offering deeper insights.
The course also covers the Power BI Service, teaching you to publish, share, and collaborate on reports and dashboards.
Practical checkpoints throughout the syllabus, labeled “Jump Into the Journey,” provide hands-on experience to reinforce your learning.
Support is available if you hit a snag, with clear contact information provided.
By the end of this course, you’ll have a robust set of skills in Power BI, ready to transform raw data into strategic insights with confidence.
Also check our posts on:
