R programming is a powerful tool for data analysis, visualization, and statistical computing.
It’s widely used in various fields, including data science, machine learning, and research, making it a valuable skill for anyone looking to work with data.
By learning R, you can gain the ability to manipulate data, build statistical models, create stunning visualizations, and extract meaningful insights from complex datasets.
Whether you’re a beginner or an experienced programmer, mastering R can open doors to exciting career opportunities and empower you to make data-driven decisions.
Finding the right R programming course can be overwhelming, especially with the abundance of options available online.
You’re searching for a course that not only covers the fundamentals but also provides practical examples, hands-on exercises, and real-world projects to solidify your understanding.
Ideally, the course should be engaging, well-structured, and taught by experienced instructors who can guide you through the intricacies of R programming.
After reviewing numerous R programming courses, we’ve identified R Programming A-Z: R For Data Science With Real Exercises! as the best course overall.
This comprehensive Udemy course offers a deep dive into R, covering everything from basic syntax to advanced statistical techniques.
It’s packed with real-world examples and exercises, making it an excellent choice for those who want to apply their knowledge to practical data science problems.
The instructor’s clear explanations and engaging teaching style make learning R enjoyable and effective.
While R Programming A-Z: R For Data Science With Real Exercises! is our top recommendation, we understand that you might have specific needs and preferences.
That’s why we’ve compiled a list of other excellent R programming courses that cater to different learning styles, skill levels, and areas of focus.
Keep reading to explore these options and find the perfect course to kickstart your R programming journey.
R Programming A-Z: R For Data Science With Real Exercises!
Provider: Udemy
You’ll begin by installing R and R Studio, available for both Mac and Windows users.
Don’t worry; the course guides you through each step.
You’ll then dive into the fundamentals, learning about variables, logical operators, and loops, essential building blocks for any programmer.
You’ll then explore vectors and discover how to perform operations on them.
This knowledge will be invaluable as you move on to matrices, learning how to create, manipulate, and visualize them using functions and packages.
You’ll use these skills to analyze relationships between different variables in datasets, such as basketball player statistics.
With a solid understanding of matrices, you’ll advance to data frames, learning how to import, explore, and manipulate data efficiently.
You’ll even master the art of data visualization with qplot, creating insightful graphs from complex data.
This course goes further by introducing you to the ggplot2 package, empowering you to create even more sophisticated visualizations based on the principles of the Grammar of Graphics.
Imagine creating stunning visualizations of movie ratings or global demographic trends.
You’ll put your newfound knowledge into practice through real-world projects using datasets on movie ratings, basketball trends, financial statements, and world trends.
The course doesn’t leave you hanging – detailed homework solutions for every section reinforce your understanding, ensuring you grasp even the trickiest concepts.
IBM Data Analytics with Excel and R Professional Certificate
Provider: Coursera
This IBM Data Analytics with Excel and R Professional Certificate on Coursera teaches you how to work with data using both Microsoft Excel and the R programming language.
You first learn about the different jobs in the data world, like Data Analysts and Data Scientists, and understand how databases and big data platforms work.
You then master Excel, a popular tool for working with data.
You learn how to prepare data, use pivot tables to summarize it, and create visualizations to present your findings.
Then, you dive into R programming, learning how to manipulate data, create visualizations with ggplot2, and build interactive dashboards with R Shiny.
You also learn how to use R to access databases, a crucial skill for any data scientist.
The program includes real-world projects using datasets, where you prepare data for analysis, create predictive models using techniques like linear regression, and build an interactive dashboard.
Data Science and Machine Learning Bootcamp with R
Provider: Udemy
This course takes you from the very beginning steps of R programming all the way to building complex machine learning models.
You start by setting up your environment on either a Windows, Mac, or Linux system.
Then, you’ll learn basic concepts like data types, how to use vectors and matrices, and how to work with data frames.
You become skilled at manipulating data with powerful tools like the dplyr and tidyr packages, and you’ll use the pipe operator to create smooth and efficient workflows.
With a strong foundation in place, you then move into creating impressive data visualizations with ggplot2, one of the most effective data visualization libraries available in R.
You’ll learn how to generate different charts and graphs, including histograms, scatterplots, barplots, and boxplots.
The course teaches you advanced techniques like faceting and creating custom themes, and you can put these new skills to the test by analyzing and visualizing real-world data in a practical, hands-on project.
Get ready to enter the exciting world of machine learning, where you’ll work with algorithms like linear regression, logistic regression, K nearest neighbors, decision trees, random forests, support vector machines, and K-means clustering.
You’ll learn how to train these models using real-world data, evaluate their performance, and use them to make accurate predictions.
You’ll even work with advanced topics like natural language processing and neural networks, gaining experience with cutting-edge applications of machine learning.
You’ll solidify your knowledge and gain practical experience through hands-on projects where you can put everything you’ve learned into action.
Data Science: Foundations using R Specialization
Provider: Coursera
This specialization is a great way to begin learning data science with the versatile R programming language.
You start by building a solid foundation, learning about the tools data scientists use every day, like R and RStudio.
You will also learn about version control with Git and GitHub, which are essential for collaborating with others and tracking changes in your code.
Next, you delve into R programming itself.
You learn to write code, read and understand data, use pre-built R packages, and debug your code when it’s not working correctly.
You will also discover how to use R for practical data analysis through real-world examples.
You will then learn how to find data from websites, databases, and APIs.
You learn to clean up messy data and organize it so you can analyze it and to properly store and share data with others.
With your clean data, you then learn how to find and communicate the important information it contains.
You will create informative visualizations like graphs and charts using R’s plotting systems like ggplot2 and explore cluster analysis techniques.
Finally, you learn how to make your data analysis projects transparent and easily repeatable by others.
This reproducibility is achieved using tools like Markdown and Knitr to create documents that combine your code, the data, and the results, making your work accessible and verifiable.
R Programming: Advanced Analytics In R For Data Science
Provider: Udemy
This R programming course equips you with advanced analytics techniques, going beyond the fundamentals to empower you as a data scientist.
You will master data preparation and manipulation, using functions like gsub(), sub(), which(), and is.na() to clean and prepare your data for analysis.
This practical approach ensures you can tackle real-world data challenges, such as those presented in the course’s financial review and weather pattern projects.
You will gain a strong understanding of lists in R, learning to create, name, extract components from, and subset them effectively.
This knowledge is further enhanced as you discover how to create insightful time series plots by leveraging lists and date-time functions in R.
The course then introduces you to the powerful “Apply” family of functions, including apply(), lapply(), and sapply().
You will learn to wield these functions to efficiently process and manipulate data structures, saving you valuable time and effort in your data analysis workflows.
As a bonus, you will get exclusive access to an interview with Hadley Wickham, a leading figure in the R programming world and the creator of GGPlot2.
This interview, featured on the SuperDataScience podcast, explores insightful topics like the future of R, its integration with Python, and valuable career advice.
You can listen to this interview on popular platforms like Spotify, making it easily accessible.
Data Analysis with R Specialization
Provider: Coursera
This Coursera Specialization will teach you how to analyze data using R, a popular programming language for data scientists.
You will start with the fundamentals of probability and data exploration in “Introduction to Probability and Data with R.”
This course teaches you how to collect data using various sampling methods and explore data patterns with visualization techniques.
You will learn how to calculate summary statistics and understand the basics of probability theory and Bayes’ rule.
Next, you will move on to “Inferential Statistics,” where you will dive into statistical inference, a method for drawing conclusions about populations from sample data.
You will learn how to conduct hypothesis tests, understand the meaning of p-values, and present your findings clearly and concisely.
Finally, in “Linear Regression and Modeling,” you will learn to build and interpret linear regression models.
This course will teach you how to predict a continuous response variable based on other variables, identify relationships between variables, test hypotheses about those relationships, and use your models for prediction.
Through this course, you will gain practical experience with linear regression models in R, a free statistical software you will use throughout the specialization.
Machine Learning & Deep Learning in Python & R
Provider: Udemy
This course provides a comprehensive understanding of how to use the R programming language for data science.
You’ll learn about various data types and how to organize them.
You’ll become familiar with essential statistical concepts such as mean, median, mode, and standard deviation.
The course teaches you how to visualize data effectively, including creating bar plots and histograms.
You’ll then transition into machine learning, where you’ll work with algorithms like linear regression, K-nearest neighbors, and decision trees.
The course emphasizes model evaluation using metrics like mean squared error and R-squared.
You’ll gain experience in handling real-world datasets, addressing challenges like outliers and missing values, and preparing data for modeling.
This course delves into deep learning, a more advanced form of machine learning.
You’ll learn about neural networks, understanding how they work and how to apply them to classification and regression problems.
The course also covers specialized neural networks like convolutional neural networks, well-suited for tasks such as image recognition.
You’ll learn to create and evaluate models in R using popular machine learning libraries.
Through practical exercises, you’ll develop the skills to build predictive models, make accurate forecasts, and gain insights from data using R programming.
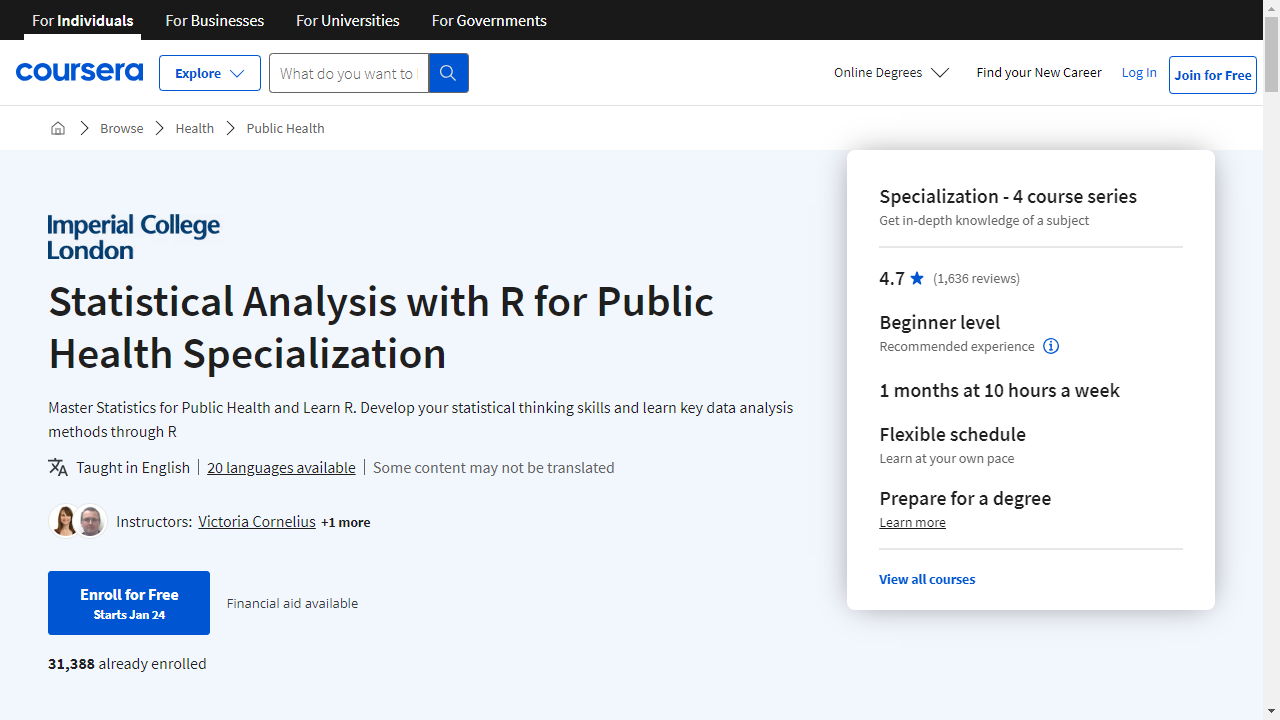
Statistical Analysis with R for Public Health Specialization
Provider: Coursera
This specialization equips you with the ability to apply R programming to real-world public health challenges.
You’ll begin with the fundamentals of statistics and data analysis, learning about variables, distributions, and hypothesis testing.
The course then guides you through using R to describe data sets, formulate hypotheses, and conduct basic analyses, using practical examples like analyzing fruit and vegetable consumption patterns.
The specialization delves deeper into the world of statistical modeling, introducing you to linear regression—a technique for modeling the relationship between variables.
You will discover how to import data, examine it, and build models that can predict health outcomes, like understanding how environmental and patient-related factors influence the likelihood of developing respiratory illnesses.
You will then explore logistic regression, a method used to predict the probability of specific events, such as the development of diabetes, based on a set of characteristics.
Finally, you’ll learn how to analyze “time-to-event” data, such as the lifespan of a patient following a heart attack, using survival analysis.
This involves understanding concepts like “hazard” and “censoring” and learning to use Kaplan-Meier plots and Cox regression.
Throughout the specialization, you’ll gain hands-on experience using R, a powerful and versatile software popular among statisticians and data scientists across various fields.
Also check our posts on:


