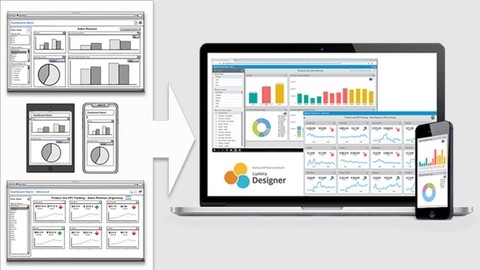
SAP Lumira is a powerful business intelligence (BI) tool that enables users to visualize data, create interactive dashboards, and gain valuable insights from their information.
Learning SAP Lumira can open doors to exciting opportunities in data analysis, business intelligence, and reporting.
By mastering this tool, you can contribute to data-driven decision making, improve business processes, and gain a competitive advantage.
Finding a high-quality SAP Lumira course on Udemy can feel like searching for a needle in a haystack, as many options exist, each with its own approach and curriculum.
You’re looking for a course that’s comprehensive, engaging, and taught by experts, but also fits your learning style and goals.
We’ve done the research and are confident in recommending The Complete SAP Lumira Designer Course as the best overall SAP Lumira course on Udemy.
This course goes beyond the basics, offering a deep dive into creating sophisticated and interactive dashboards, incorporating features like data acquisition from various sources, scripting for customization, and building complex visualizations.
While this is our top choice, there are other valuable courses available on Udemy for learners with different needs and skill levels.
Keep reading to explore our curated list of recommendations and discover the perfect SAP Lumira course for your learning journey.
The Complete SAP Lumira Designer Course

This course dives deep into the world of SAP Lumira Designer, taking you on a journey from building basic dashboards to creating sophisticated, interactive visualizations.
You’ll start by mastering the fundamentals of dashboard design, learning how to craft effective KPIs, leverage size and position for hierarchy, and present numbers with clarity.
The course goes beyond theory, guiding you through the creation of your first dashboard in Lumira Designer.
You’ll learn to acquire data from diverse sources like SAP Business Warehouse (BW), BusinessObjects Universe, SAP HANA, and even Excel.
You’ll explore your data using Lumira Discovery and transform it into visually appealing applications.
Scripting techniques will be introduced to help you customize your dashboards, including the creation of a cascade style sheet (CSS) file for precise styling of your dashboard components.
But the real learning begins with building a comprehensive retail dashboard using Lumira Designer.
This hands-on project will provide you with practical experience using various components like charts, tables, filters, and containers.
You’ll learn to create a popup window for KPI information and implement advanced features such as bookmarks, comments, and parameter passing between different dashboards.
To ensure your dashboards run smoothly, you’ll delve into performance optimization techniques.
You’ll encounter essential concepts like the Bookmark, Dialog Box, Adaptive Layout, Spreadsheet, Donut Chart, Grid Layout, and Scorecard throughout the course.
You’ll explore concepts like Parent-Child Relation, Nested Components, and even learn how to format sales revenue effectively.
SAP Lumira Discovery 2.3 from Beginner to Professional

This comprehensive course on SAP Lumira Discovery takes you from novice to proficient, covering a wide range of topics from the fundamentals to advanced data visualization and integration with the SAP BI Platform.
You’ll begin by getting acquainted with Lumira Discovery, setting up the software, and learning to navigate the user interface.
The course then dives into the core of data analysis, teaching you to acquire data from various sources, including live connections to HANA and importing files.
You’ll master essential data manipulation techniques, including creating objects, hierarchies, and data actions, as well as more advanced features like calculated objects and merging datasets.
Each module is reinforced with hands-on exercises to ensure practical understanding.
Next, you’ll explore the exciting world of data visualization and storytelling.
You’ll learn to create visually engaging charts and graphs using the canvas and chart builder, including advanced options like crosstabs and geo maps with ESRI ArcGIS integration.
The course covers techniques for linking visualizations, adding interactive filters and input controls, and formatting your stories for optimal impact.
As you progress, you’ll discover how to effectively share and export your data stories, as well as integrate Lumira Discovery with the SAP BI Platform.
You’ll learn the functionalities, options, and limitations of Lumira Discovery within the BI Platform environment.
You’ll also find valuable bonus lectures covering essential topics like converting Lumira 1.x files to 2.x versions, interoperability with Lumira Designer, and installing extensions.
You’ll have access to helpful resources like help pages, video links, and troubleshooting tips to aid your learning journey.
This course offers a comprehensive and structured approach to mastering SAP Lumira Discovery, equipping you with the skills to effectively analyze, visualize, and communicate data insights.
SAP Lumira Designer 2.X (Design Studio)

This SAP Lumira Designer 2.X course, often referred to as Design Studio, is a comprehensive guide to building dynamic and interactive reports.
You’ll start by understanding the core concepts, including the architecture and how to access Lumira Designer.
The course then dives into connecting to data sources like HANA and BW, providing the foundation for creating powerful analyses.
You’ll learn to incorporate components like crosstabs and info charts into your reports, and then use CSS to customize them for a polished look.
The navigation panel and dimension filter are powerful tools, and this course will equip you with the knowledge to use them effectively to navigate your data.
As you progress, you’ll explore more advanced features like creating dynamic behaviors using radio buttons.
You’ll master scripting to build complex interactions and utilize list boxes to enhance your reports’ interactivity.
You’ll learn how to create applications with tabs and grid layouts to organize your information, and you’ll master conditional statements in scripting to control the flow of your reports.
You’ll also delve into the use of local variables and explore how to display report information and master data values.
This course even delves into advanced topics like using geo maps, scorecards, and the interoperability between Lumira Discover and Designer, enabling you to create visually appealing and sophisticated reports.
You’ll have a strong grasp of key concepts like navigation panels, dimension filters, LUMX format, BI Platform, and data source connections to HANA and BW.
Data Analytics with SAP Lumira

You’ll start with the fundamentals, learning how to acquire data from various sources, including SAP systems, spreadsheets, and cloud databases.
The course guides you through the essential process of data preparation, transforming raw data into a format ready for analysis.
You’ll delve into creating measures and dimensions, the building blocks of your analysis, and explore how to leverage time and geographical hierarchies to analyze data across different periods and locations.
The course then shifts to data visualization, covering a variety of chart types, including column charts, pie charts, line charts, scatter plots, and geo charts.
These visualizations will help you uncover patterns and trends in your data and effectively communicate your findings.
You’ll learn how to create dashboards that combine multiple visualizations and share them with colleagues.
The course concludes with an introduction to SAP Lumira Cloud, a powerful cloud-based platform for creating and sharing interactive data visualizations.
You’ll gain hands-on experience creating an SAP Lumira Cloud account and learn how to use it to manage your data and visualizations.