Spatial data analysis is the process of examining and interpreting geographical data to gain insights and solve problems related to locations, patterns, and relationships.
It’s essential for diverse fields like environmental science, urban planning, and public health, as it allows professionals to understand how phenomena occur in space and how they interact.
By learning spatial data analysis, you can develop skills to analyze geographic data, create maps, and perform complex calculations to make informed decisions about the world around you.
Finding a good spatial analysis course on Udemy can be challenging, as there are many options available.
You’re likely looking for a program that is comprehensive, engaging, and taught by experienced instructors, but also fits your learning style and goals.
For the best spatial analysis course overall on Udemy, we recommend Core Spatial Data Analysis: Introductory GIS with R and QGIS.
This course provides a strong foundation in spatial data analysis concepts, equipping you with practical skills using the powerful tools of R and QGIS.
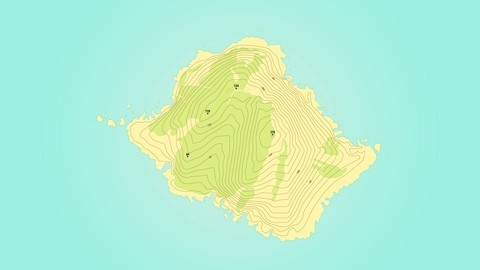
You’ll learn to work with both raster and vector data, performing tasks like analyzing elevation data, creating visualizations, and performing basic analysis.
It’s an excellent starting point for anyone looking to gain hands-on experience in spatial analysis.
While this course is our top pick, we’ve identified several other excellent options on Udemy, tailored to different learning levels and interests.
Keep reading to explore our curated list of recommendations and find the perfect spatial analysis course for you!
Core Spatial Data Analysis: Introductory GIS with R and QGIS

You’ll start by learning the fundamentals of spatial data analysis and relevant concepts.
Then, you’ll dive into working with raster data, mastering skills like reading and modifying raster bands, false color composites, band arithmetic, reclassifying to categorical rasters, resampling, clipping, and deriving topographic products.
The course also focuses on vector data, teaching you how to read and explore shapefiles, create visualizations, subset and split data, and perform basic analysis.
Additionally, you’ll learn about built-in geospatial datasets in R, Open Street Maps, GitHub, and even a Brazil time-lapse project.
Throughout the course, you’ll gain hands-on experience with both R and QGIS, two powerful tools for spatial analysis.
You’ll learn how to assign legends in QGIS and work with POSIT, a platform for sharing code and collaborating.
The course covers a wide range of techniques, from basic statistics calculations on rasters to working with raster stacks, categorical rasters, and CRS modifications.
ArcGIS Desktop For Spatial Analysis: Go From Basic To Pro

The course starts by introducing spatial data analysis concepts and providing access to tutorial data.
This lays the foundation for working with ArcGIS Desktop, the powerful geographic information system (GIS) software.
You’ll dive into ArcGIS Desktop’s functionality, learning how to access spatial data, make selections, zoom and measure, and handle different coordinate systems.
The course then covers working with raster data in ArcGIS, including displaying, merging, and performing band arithmetic on rasters.
You’ll also learn topographic calculations, zonal statistics, and geo-referencing rasters.
These skills are essential for analyzing elevation and terrain data.
Moving on to vector data, you’ll explore exploratory data analysis with shapefile attributes, spatial joins, creating choropleth maps, and various geoprocessing tasks like clipping, intersecting, and buffering shapefiles.
This section equips you with the tools to analyze and manipulate vector spatial data effectively.
The course also delves into advanced geoprocessing tasks like euclidean distance raster generation, density analysis, interpolation, and mapping spatial clusters.
You’ll even learn about geographically weighted regression, a powerful statistical technique for spatial analysis.
To streamline your workflows, you’ll learn how to use Model Builder in ArcGIS to automate geoprocessing tasks.
This can save you significant time and effort when working with large datasets.
Finally, the course covers map making in ArcGIS, teaching you how to present spatial data effectively using layers, basemaps, and cartographic design principles.
You’ll be able to create professional-looking maps that communicate your analysis results clearly.
Fundamentals of Remote Sensing and Geospatial Analysis
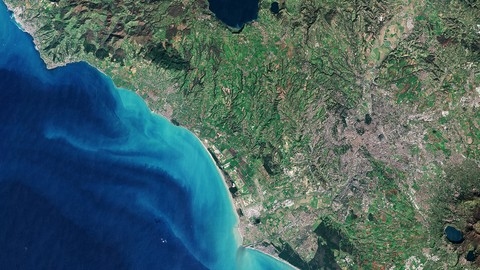
You will learn about remote sensing, which involves acquiring data about the Earth’s surface from a distance, typically from satellites or aircraft.
The course starts by introducing the electromagnetic spectrum and how light interacts with the atmosphere and the Earth’s surface.
You’ll understand concepts like Rayleigh and Mie scattering, which are crucial for interpreting remote sensing data.
You’ll then dive into the different types of sensors used in remote sensing, including passive and active sensors, as well as multispectral and hyperspectral sensors.
The course covers the various resolutions involved in remote sensing, such as spatial, spectral, and temporal resolutions.
One of the key topics is pre-processing techniques, including geometric and radiometric calibration, as well as atmospheric corrections.
These steps are essential for accurately interpreting the remote sensing data.
The course also covers classification techniques, which allow you to identify different features on the Earth’s surface based on their spectral signatures.
You’ll learn about spectral signature analysis for vegetation and geological features, as well as how to create custom ratios for specific applications.
Towards the end, you’ll be introduced to various software tools and data access methods used in remote sensing.
The course also provides a comprehensive cheat sheet and reference guide, which will be a valuable resource for your future work in this field.
Throughout the course, you’ll have the opportunity to reinforce your learning through quizzes and a bonus lecture.
[Intermediate] Spatial Data Analysis with R, QGIS & More
![[Intermediate] Spatial Data Analysis with R, QGIS & More](/img/best-spatial-analysis-courses-udemy/1030486_IntermediateSpatialDataAnalysiswithRQGISMore.jpg)
You’ll start by learning the key concepts and software tools like R, QGIS, and GRASS GIS.
From there, you’ll dive into mapping and visualizing spatial data using shapefiles, exploring both qualitative and quantitative attributes.
The course covers essential vector geoprocessing techniques like spatial joins, buffers, unions, clips, and intersections, all using QGIS and R. You’ll learn to analyze and map point pattern data, create heat maps, and perform interpolation methods like thin spline, inverse distance weighting, and kriging.
Raster data processing is also covered in-depth, including displaying rasters, calculating zonal statistics, merging and clipping rasters with shapefiles in QGIS, R, and GRASS GIS.
You’ll even learn terrain analysis in GRASS GIS and georeferencing in QGIS.
This course goes beyond the basics by introducing more advanced topics like the QGIS graphical modeler for automating analysis, multi-criteria decision making and suitability analysis.
You’ll also get a taste of web mapping in QGIS and R.
Throughout the course, you’ll work with real-world geospatial data, learning to visualize and analyze it using powerful tools like ggplot2 and GitHub.
You’ll even explore a Brazil time lapse dataset.
Spatial Analysis & Geospatial Data Science in Python
You will learn how to perform geospatial data analysis and visualization using Python.
The course starts with an introduction to the life-cycle of a spatial analysis project, covering key stages like business understanding, data extraction, transformation, and exploratory analysis.
The first project focuses on the Zomato dataset, where you’ll learn data preprocessing techniques specific to spatial data, such as extracting latitudes and longitudes.
You’ll then perform spatial analysis, including creating heatmaps to visualize restaurant density, marker cluster analysis, and plotting markers on a map.
The second project dives into global warming analysis.
You’ll analyze average temperatures across countries, seasons, and regions like US states and major Indian cities.
This involves spatial analysis techniques like choropleth maps to visualize temperature variations.
The third and most extensive project covers COVID-19 data analysis.
You’ll learn how to read and preprocess COVID-19 datasets, perform spatial analysis using choropleth maps and geographical scatter plots for confirmed cases, recoveries, and deaths.
Additionally, you’ll create interactive visualizations with markers, marker clusters, and geographic heatmaps.
Throughout the course, you’ll gain hands-on experience with popular Python libraries like Pandas, Folium, and Plotly for spatial data manipulation and visualization.
You’ll also learn about key geospatial concepts like tilesets, raster data, and vector data.
The course covers data cleaning techniques and dealing with missing values too.
Spatial Analysis and Geospatial Data Science With Python

You’ll start by learning the fundamentals of Python and its essential data manipulation library, Pandas.
Once you have a solid grasp of these tools, the course dives into the world of geospatial data analysis with Geopandas.
You’ll learn how to read and work with spatial data, perform spatial operations like joins, buffers, and overlay analysis, and even explore nearest neighborhood analysis.
The course covers coordinate reference systems, ensuring you understand how to handle spatial data accurately.
But the real power lies in visualizing your geospatial data.
You’ll learn to create multi-layer maps, choropleth maps, and bubble maps using Geopandas’ built-in visualization capabilities.
And if you want to take it a step further, the course introduces you to interactive visualization libraries like Folium, IpyLeaflet, and Plotly Express, allowing you to create dynamic, web-based maps.
Advanced topics like geocoding, reverse geocoding, and retrieving data from OpenStreetMap are also covered, giving you the skills to work with real-world geospatial data sources.
The course even provides tips to optimize your geospatial processing, ensuring you can handle large datasets efficiently.
Throughout the course, you’ll work hands-on with Jupyter Notebooks, a powerful tool for interactive coding and data analysis.
Google Earth Engine for Machine Learning & Change Detection
You’ll get hands-on experience working with Google Earth Engine, a powerful cloud-based platform for analyzing geospatial data.
The course starts by introducing you to Google Earth Engine and its code editor, where you’ll learn how to work with various datasets and perform basic image analysis tasks.
You’ll get familiar with JavaScript, the programming language used in Earth Engine, and learn how to declare variables, map and reduce collections, and visualize images.
From there, you’ll dive into machine learning concepts and their applications in GIS and remote sensing.
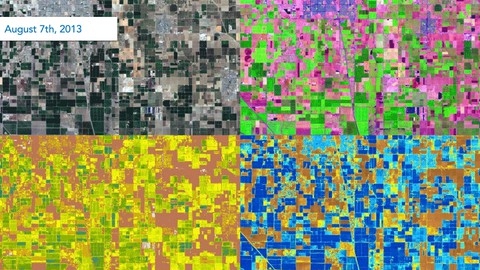
The course covers both supervised and unsupervised classification techniques, such as Random Forest and K-means clustering, which are essential for land use/land cover (LULC) mapping and change detection analysis.
You’ll learn the entire workflow of supervised classification, from importing and visualizing satellite imagery like Landsat data, to training machine learning models, classifying images, and assessing the accuracy of your LULC maps.
The course also introduces you to change detection techniques, including the Normalized Burn Ratio (NBR) index for mapping burn severity and time series trend analysis using linear regression.
Throughout the course, you’ll work on hands-on labs and a final project, giving you practical experience in applying the concepts you’ve learned.
The labs cover tasks like calculating NDVI, mosaicking and clipping images, exporting data, and implementing various classification algorithms in Earth Engine.
Practical QGIS For Spatial Data Analysis: Beginner to Expert
The course starts by introducing you to basic spatial data concepts and installing QGIS, a powerful open-source GIS software.
You’ll dive right into working with shapefiles, learning how to read different types, explore attributes, calculate geometric properties, select features, fix invalid geometries, and perform operations like splitting, merging, clipping, and intersecting.
The course also covers working with point data from CSVs and advanced techniques like buffers, centroids, and spatial joins.
Moving on, you’ll work extensively with raster data, understanding categorical versus continuous rasters, visualization techniques, computing areas and proportions, and deriving topographic attributes from elevation data.
The course integrates SAGA tools for advanced raster processing like normalization.
You’ll learn to analyze both raster and vector data together, computing zonal statistics, clipping rasters to shapefiles, and extracting raster values to points.
Spatial analysis techniques like kernel density estimation and interpolation are also covered.
Excitingly, the course integrates with Google Earth Engine (GEE), teaching you to obtain country outlines, DEMs, and even Landsat satellite imagery directly within QGIS.
You’ll also learn about geocoding and connecting QGIS with R for advanced analysis.
Machine Learning in Spatial Analysis: GIS & Remote Sensing
You will start by learning the fundamentals of GIS and remote sensing, including installing and exploring the powerful open-source software QGIS.
The course then dives into machine learning concepts and how they can be applied to spatial data analysis.
One key focus is on supervised and unsupervised learning algorithms for image classification tasks using data from sources like Sentinel-2 and Landsat satellites.
You’ll get hands-on experience with tools like EO Browser and Google Earth Engine for cloud-based analysis.
The course also covers advanced topics like object-based image analysis (OBIA), where you’ll learn techniques for segmentation and object detection in high-resolution satellite imagery.
Additionally, you’ll explore how machine learning can be used for regression analysis and prediction tasks in GIS.
Throughout the course, you’ll work with real-world datasets and gain practical experience in applying machine learning models to solve spatial problems.
The final project involves implementing machine learning workflows on the Google Earth Engine platform.
Advanced Google Earth Engine(GEE) For Spatial Data Analysis

You’ll start by learning the basics of GEE and spatial concepts, then dive into working with various data types like imagery, shapefiles, and DEMs.
One highlight is the in-depth coverage of optical data, including Landsat and Sentinel.
You’ll learn how to process and analyze this data, compute vegetation indices, and create cloud-free composites.
The course also covers SAR data like Sentinel-1, teaching you to map flooding and work with different polarizations.
Machine learning is a key focus, with sections on both unsupervised and supervised classification using GEE.
You’ll collect training data, define classifiers, and assess accuracy metrics.
Other advanced topics include spectral unmixing, tensors, and object-based image analysis (OBIA) in GEE.
Beyond just imagery, you’ll work with socio-economic data like nightlights and explore fire patterns using MODIS data.
The course equips you with JavaScript skills for the GEE code editor and shows how to upload your own geospatial data.
With a wide range of datasets and techniques covered, from basic filtering to machine learning, this course offers a comprehensive introduction to spatial analysis in the powerful Google Earth Engine environment.
You’ll gain hands-on experience analyzing real-world data and problems.