Statistics is a fundamental field that empowers us to analyze data, draw meaningful conclusions, and make informed decisions.
From understanding trends and patterns to predicting future outcomes, statistics plays a crucial role in various domains, including science, business, healthcare, and social sciences.
By mastering statistical concepts and techniques, you can unlock valuable insights from data and gain a competitive edge in your chosen field.
Finding the right statistics course can be a challenge, given the abundance of options available online.
You’re searching for a course that strikes the right balance between theoretical foundations and practical applications, providing you with the knowledge and skills to confidently tackle real-world data analysis challenges.
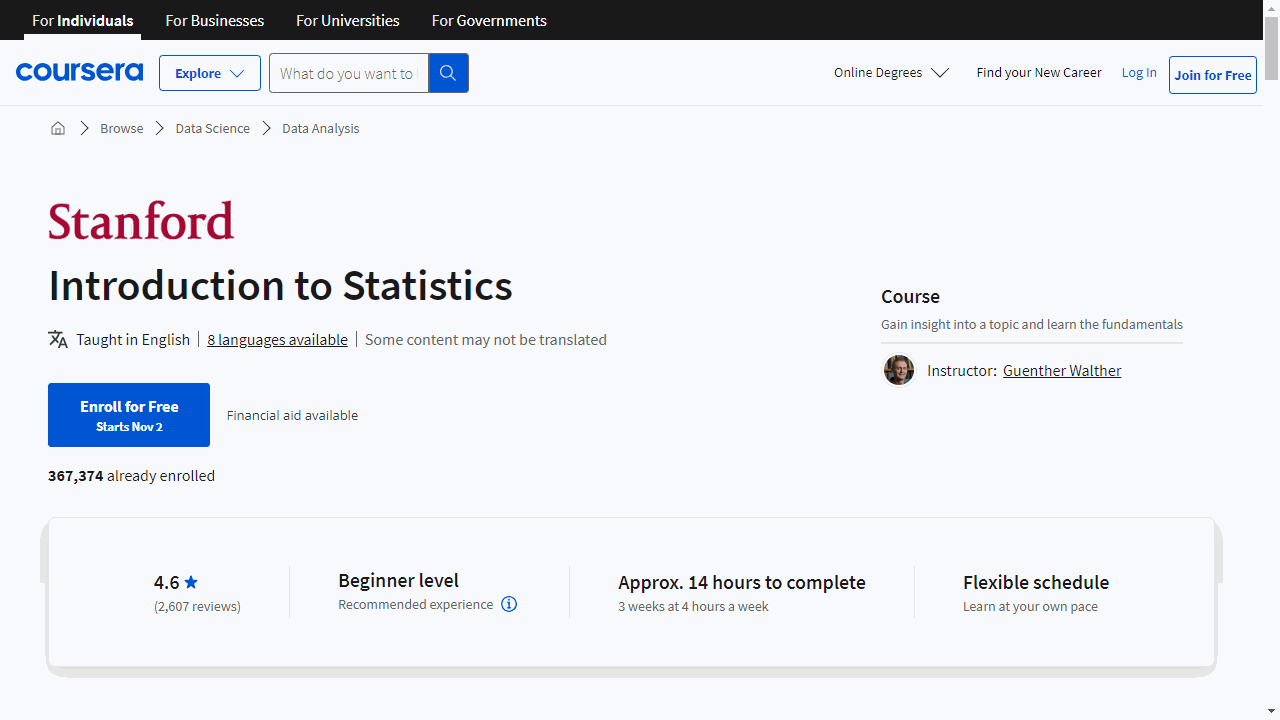
For the best statistics course overall, we recommend Introduction to Statistics by Stanford University on Coursera.
This comprehensive course covers a wide range of essential topics, from descriptive statistics and probability to hypothesis testing and regression analysis.
With clear explanations, engaging examples, and hands-on exercises, it provides a solid foundation for anyone looking to delve into the world of statistics.
While Introduction to Statistics is our top pick, we understand that you might have specific needs or preferences.
Keep reading to discover other excellent statistics courses that cater to different learning styles, skill levels, and areas of focus.
Stanford University’s Introduction to Statistics

Provider: Coursera
In this course, you will begin with the fundamentals of statistics, exploring various charts and graphs like bar graphs, histograms, and box-and-whisker plots.
You will learn how to calculate the mean, median, and standard deviation to analyze data.
The course then delves into sampling methods, teaching you about simple random sampling and stratified random sampling.
You will also discover the difference between observation and experimentation and how to identify and avoid bias and confounding variables in your data.
The course will then guide you through the principles of probability.
You will learn how to calculate probabilities, solve problems using concepts like complement, addition, and multiplication rules, and apply Bayes’ Rule.
You will become familiar with the normal curve and learn how to standardize data and calculate percentiles.
Additionally, the course will introduce you to the binomial distribution, where you’ll learn how to analyze events with two possible outcomes.
Building on this foundation, you will delve into the concepts of parameter and statistic.
You will discover how to calculate expected values and standard errors, and you will learn about the square root law.
The course emphasizes the importance of the sampling distribution, the central limit theorem, and how these concepts are used to estimate population parameters from sample data.
You will also explore regression analysis, learning to calculate correlation coefficients, fit regression lines using the method of least squares, and make predictions.
You will learn about confidence intervals, how to construct them using the central limit theorem and the bootstrap principle, and how to use them to estimate population parameters.
You will also explore hypothesis testing and learn to calculate p-values.
You will use methods like the t-test and the two-sample z-test to evaluate data and draw meaningful conclusions.
Finally, you will explore ANOVA, used to compare means across multiple groups, and learn techniques to ensure your statistical analyses are robust and reliable, including methods like the Bonferroni correction to avoid the multiple testing fallacy.
Statistics for Data Science and Business Analysis
Provider: Udemy
This Udemy course on Statistics for Data Science and Business Analysis equips you with the fundamental statistical knowledge needed for data-driven decision-making.
You begin by grasping the difference between sample and population data – the bedrock of accurate statistical inferences.
You then delve into descriptive statistics, learning about different data types like categorical and numerical data and their measurement levels.
You explore visualization techniques like frequency distribution tables, bar charts, and histograms to understand data distribution.
You learn to calculate and interpret essential statistical measures like mean, median, mode, variance, standard deviation, and correlation coefficient, enabling you to summarize and analyze data effectively.
The course then introduces you to the fascinating world of inferential statistics.
You understand the concept of distributions, particularly the Normal and Standard Normal distributions, and their significance in statistical analysis.
You delve into the Central Limit Theorem, standard error, and confidence intervals, learning to make predictions and inferences from sample data.
The course teaches you how to calculate confidence intervals for different scenarios, including cases with known and unknown population variances, and for both dependent and independent samples.
You then explore hypothesis testing, learning to formulate null and alternative hypotheses and determine the significance level for decision making.
You understand the types of errors in hypothesis testing – Type I and Type II – and how to interpret p-values.
The course covers various tests for the mean, including those for dependent and independent samples with known and unknown variances.
You’ll apply these techniques to real-world datasets, solidifying your understanding of hypothesis testing in practical contexts.
Finally, you dive into regression analysis, starting with the simple linear regression model.
You learn to interpret regression tables, understand R-squared and adjusted R-squared, and explore the ordinary least squares (OLS) method.
The course highlights the assumptions of linear regression, teaching you how to identify and address violations.
You learn how to incorporate categorical data into your analysis using dummy variables.
The course culminates with a practical example where you build a regression model using real-life data, predicting car prices based on various factors.
Statistics with Python Specialization
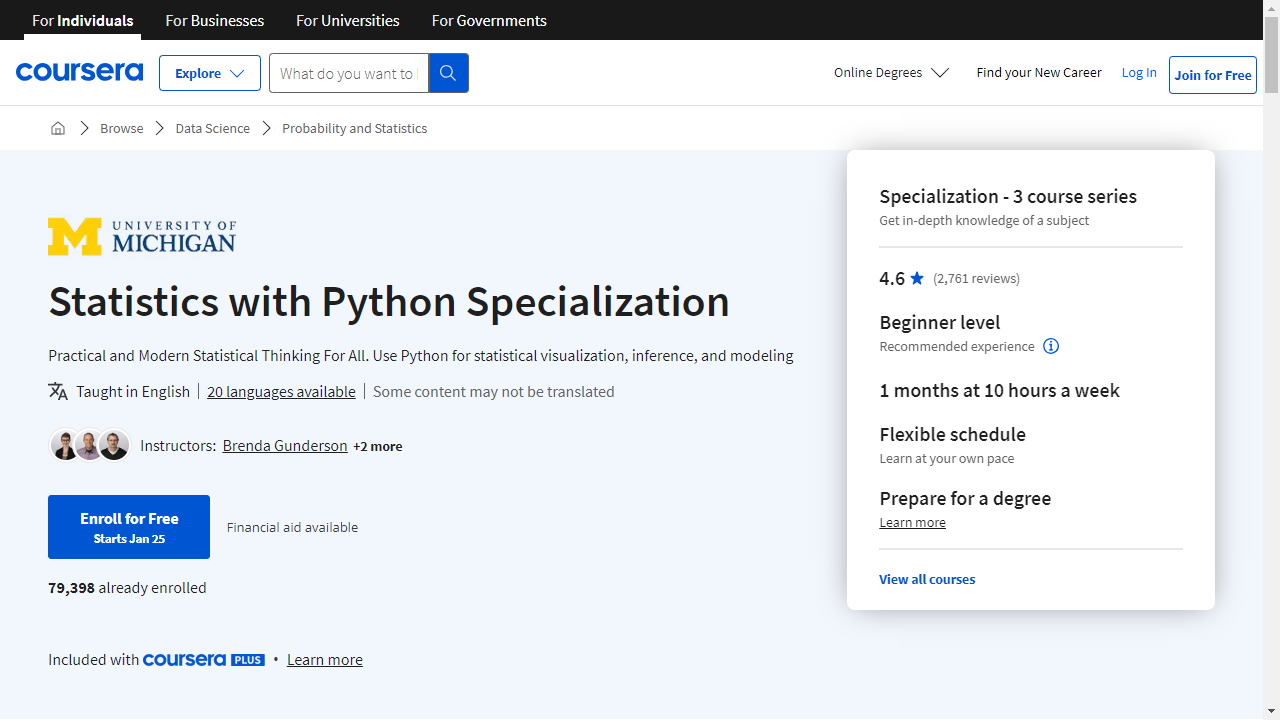
Provider: Coursera
This specialization guides you through the world of statistics with Python.
You start by building a strong foundation in data analysis, exploring different data types, and learning how to create insightful visualizations using libraries like Matplotlib and Seaborn.
You learn to communicate statistical ideas effectively, preparing you to share your findings with others.
You then explore inferential statistics, discovering how to use sample data to make predictions about larger populations.
You master the art of constructing confidence intervals and performing hypothesis tests using Python libraries like Statsmodels, gaining valuable insights from your data.
Finally, you dive into the world of statistical modeling, learning to connect research questions with the right analysis methods.
You explore powerful techniques such as linear regression, logistic regression, and Bayesian inference, using real-world data sets to build and apply your own statistical models.
This hands-on experience with libraries like Statsmodels and Pandas equips you with the skills to analyze complex datasets and make accurate predictions.
Become a Probability & Statistics Master

Provider: Udemy
This course guides you through a comprehensive journey to becoming proficient in probability and statistics.
You start with the fundamentals of data visualization, mastering the art of presenting data through various charts and graphs, including bar graphs, pie charts, line graphs, and Venn diagrams.
This foundation in data representation is crucial for understanding the patterns and trends revealed in later sections.
Next, you delve into the core of data analysis, learning to calculate essential measures.
You master measures of central tendency, including the mean, median, and mode, to pinpoint the typical value within a dataset.
Additionally, you learn about measures of spread, such as range and standard deviation, giving you insight into how data is distributed.
This knowledge allows you to grasp the overall picture your data presents.
The course then guides you through the intricacies of data distributions, introducing you to different shapes, including the crucial concepts of normal and skewed distributions.
You explore z-scores and Chebyshev’s Theorem, which are essential for understanding how individual data points relate to the overall distribution.
This section equips you to recognize and interpret the underlying patterns hidden within your data.
Probability, a cornerstone of statistical analysis, is thoroughly covered next.
You become comfortable with simple probability, independent and dependent events, and conditional probability, gaining the ability to analyze and predict the likelihood of events.
The course also introduces you to Bayes’ Theorem, a powerful tool for updating your understanding of events based on new information.
You then explore the fascinating world of discrete random variables.
You discover various types, like binomial, Poisson, and geometric random variables, and understand how to calculate probabilities in each case.
The concepts of permutations and combinations are also explained, equipping you to tackle a wider range of probability problems.
Sampling, a crucial aspect of real-world data analysis, is your next stop.
You explore different types of studies and learn the importance of avoiding bias in your samples.
The course introduces the concepts of sampling distributions for both the sample mean and sample proportion, providing you with the tools to make accurate inferences about an entire population based on a smaller sample.
Finally, you arrive at the powerful realm of hypothesis testing.
This section teaches you how to rigorously test claims about populations using data collected from samples.
You become familiar with formulating different types of hypotheses, choosing appropriate significance levels, calculating p-values, and interpreting the results of your tests.
Armed with these skills, you are well-prepared to draw meaningful conclusions from your data and make well-informed decisions.
Data Analysis with R Specialization
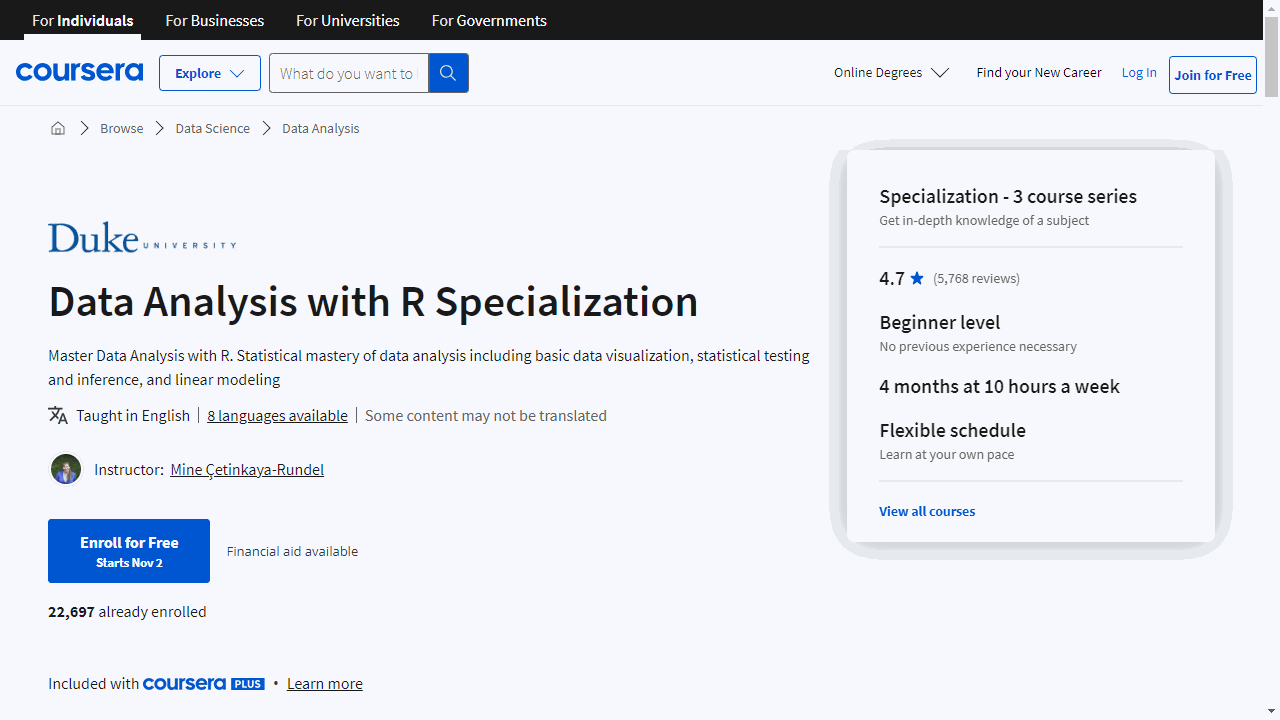
Provider: Coursera
The “Data Analysis with R Specialization” on Coursera teaches you to analyze data with R, a powerful tool used every day by statisticians around the world.
This course starts with “Introduction to Probability and Data with R,” teaching you about sampling methods and their impact on your conclusions.
You learn to use RStudio for data analysis, calculate numeric summaries of data, and create visualizations.
You even explore Bayes’ rule, a fundamental probability concept.
Next, in “Inferential Statistics,” you learn how to draw conclusions about large groups based on smaller samples.
You dive into hypothesis testing, interpreting p-values (which tell you how meaningful your results are), and reporting your findings clearly.
You learn to express uncertainty in your results, crucial for communicating findings accurately.
“Linear Regression and Modeling” takes you deeper, teaching you to build models that reveal relationships between variables.
Imagine predicting student evaluations based on a professor’s attractiveness – that’s the power of regression models!
You use real-world examples to understand how to build, analyze, and use these models in R. By the end, you possess a solid understanding of data analysis, using R to explore, analyze, and interpret data effectively.
Statistics for Business Analytics and Data Science A-Z™
Provider: Udemy
This Udemy course equips you with practical statistical skills for business analytics and data science.
You begin by grasping the fundamentals of distributions, learning how to describe data spread, calculate essential measures like standard deviation, and analyze both normal and skewed data.
You then explore the Central Limit Theorem, understanding its role in drawing inferences about populations from samples and utilizing the z-score for analyzing normal distributions.
This knowledge helps you tackle real-world analytics challenges effectively.
The course then guides you through hypothesis testing, teaching you how to determine statistical significance.
You learn about p-values, the steps involved in hypothesis testing, and how to conduct various types of tests like proportion testing, t-tests, and both one-tailed and two-tailed tests.
You even delve into advanced concepts, such as understanding the implications of not rejecting the null hypothesis and applying these techniques to real-life situations.
Bayesian Statistics Specialization
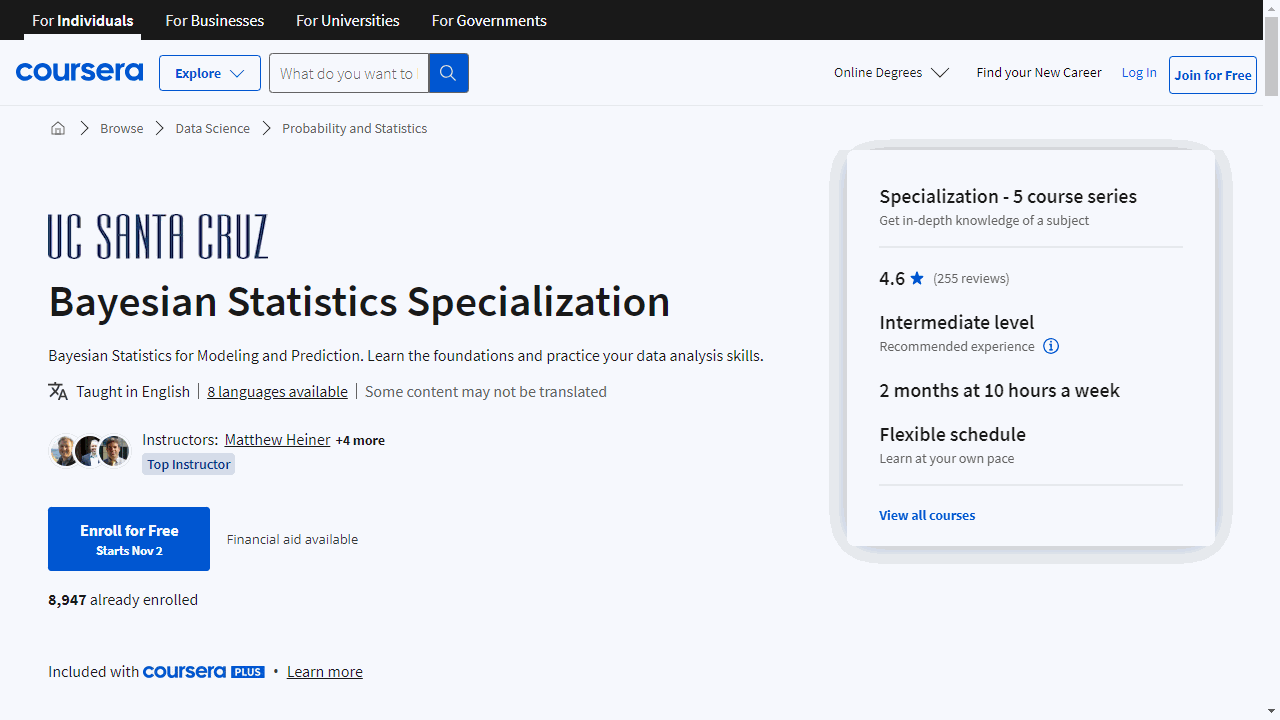
Provider: Coursera
This specialization equips you with the tools of Bayesian statistics, a powerful approach to understanding and analyzing data, essential for any data analyst.
You will begin by exploring the fundamental concepts of Bayesian statistics and learn how it differs from the more traditional Frequentist approach.
You’ll discover how the Bayesian approach provides a more intuitive way to handle uncertainty in data analysis and leads to more interpretable results.
You even have the choice of using familiar software like Microsoft Excel or diving into the world of R programming, a popular choice among statisticians.
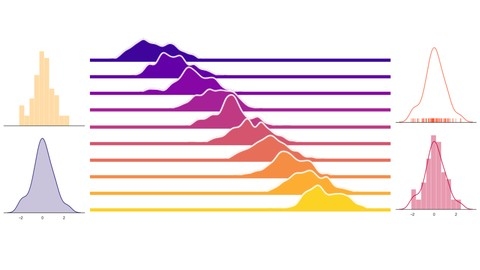
You will then go beyond the basics and explore more advanced techniques, such as Markov chain Monte Carlo (MCMC) methods.
MCMC methods are like powerful tools that allow you to analyze complex data sets that you encounter in real-world scenarios.
You will become comfortable using R and JAGS, another statistical software package, to build and evaluate sophisticated statistical models, expanding your data analysis toolkit.
Next, you will uncover the world of Mixture Models.
These models are particularly useful for handling data that comes from different sources or represents distinct groups.
Imagine you are analyzing customer data – mixture models can help you identify different customer segments based on their purchasing behavior.
You will learn how to apply these models to real-world problems using R.
You will then journey into the fascinating world of Time Series Analysis.
This is where you’ll learn how to analyze data that changes over time, like stock prices or weather patterns.
Imagine you are trying to predict future sales for your business – time series analysis techniques can help you model trends and seasonality to make informed forecasts.
You will master the art of building models that capture these temporal dependencies and use them for both understanding past patterns and predicting future values, all using the versatile R software.
Finally, you get to apply everything you’ve learned in a capstone project.
This project is your opportunity to showcase your skills and tackle a real-world data analysis problem.
You will use your knowledge of Bayesian statistics, including techniques like Markov models and mixture models, to analyze a complex data set.
This hands-on experience will solidify your understanding and give you the confidence to apply Bayesian statistics to solve real-world challenges.
Probability and Statistics for Business and Data Science
Provider: Udemy
This course equips you with the essential tools of probability and statistics, directly applicable to business and data science.
You begin with the fundamentals of data – understanding different types and how to measure them.
You learn about mean, median, and mode, along with standard deviation and variance, which help you grasp the distribution of data.
You then delve into the world of probability, exploring permutations, combinations, and the relationships between events.
This knowledge allows you to calculate the likelihood of complex events and make informed predictions.
The course introduces you to various statistical distributions like uniform, binomial, Poisson, and normal distributions, teaching you how to apply these models to real-world scenarios.
Through the principles of sampling and the Central Limit Theorem, you discover how to make accurate inferences about populations from sample data.
You learn about hypothesis testing, a crucial skill for drawing conclusions from data, and you practice calculating confidence intervals and understanding the implications of Type 1 and Type 2 errors.
The course also covers ANOVA, a powerful technique for comparing multiple groups.
You gain experience with linear and multiple regression analysis, allowing you to model relationships between variables and make predictions.
Finally, you learn how to use Chi-Square analysis to examine relationships between categorical variables, equipping you with a comprehensive toolkit for data analysis.
Also check our posts on: