Statistics is the science of collecting, analyzing, and interpreting data to uncover patterns, trends, and insights.
It’s a vital skill in today’s data-driven world, enabling you to make informed decisions in various fields, from healthcare and finance to marketing and research.
Learning statistics can help you understand the world around you, interpret information critically, and contribute meaningfully to your chosen profession.
Finding the right statistics course on Coursera can be overwhelming, especially with so many options available.
You want a course that’s engaging, comprehensive, and taught by experts, but also fits your specific learning style and goals.
It’s understandable if you’re feeling lost in the sea of statistics courses!
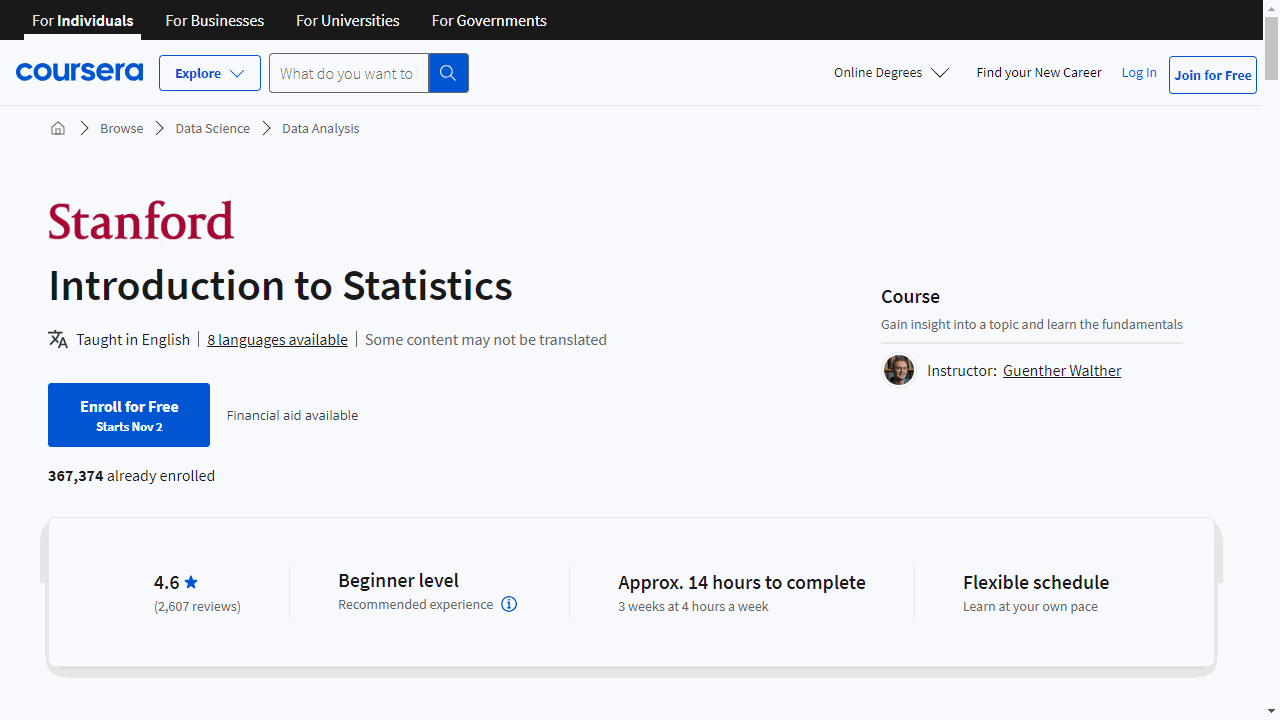
For the best statistics course overall on Coursera, we recommend Introduction to Statistics by Stanford University.
This course provides a solid foundation in statistical concepts, techniques, and tools, presented in an approachable manner.
Taught by renowned professor Guenther Walther, it combines clear explanations with interactive exercises, making learning both effective and enjoyable.
While this is our top pick, there are other excellent statistics courses available on Coursera, tailored to different learning styles and career goals.
Keep reading to discover more options, from hands-on programming courses to specialized programs in fields like business, biostatistics, and social sciences.
Introduction to Statistics By Stanford University
This Coursera course is a great option for learning introductory statistics.
Taught by Guenther Walther (Stanford University), the course provides a practical foundation in statistical concepts, techniques, and tools.
Through video lectures and hands-on exercises, you’ll gain experience working with different types of data visualizations like pie charts, histograms, and scatter plots.
The course covers important topics like random sampling methods, calculating percentiles and standard deviation, conducting hypothesis tests, and more.
Key benefits include:
- Develop intuition for drawing conclusions from data through simulations and real-world examples
- Learn to analyze and interpret common graphs and summary statistics
- Discover how to design experiments, calculate probabilities, and apply statistical formulas
- Practice using normal distributions, confidence intervals, ANOVA, and other core techniques
- Gain skills to make data-driven business decisions in a variety of fields
With a combination of theory and application, this course aims to make statistics approachable. You’ll come away with knowledge to apply statistical analysis to real problems and make data-informed decisions.
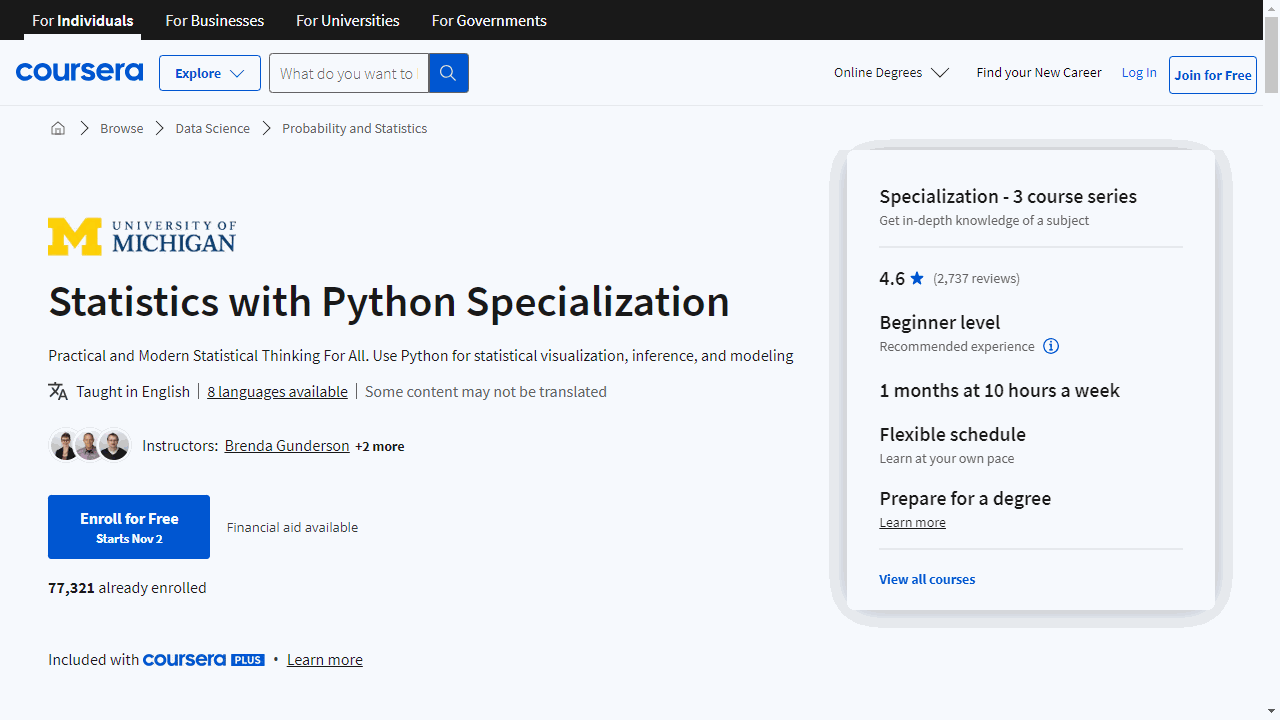
Statistics with Python Specialization
This hands-on program, offered by the University of Michigan, gives you a solid foundation in statistical concepts and techniques using the powerful Python programming language.
In the first course, Understanding and Visualizing Data with Python, you’ll learn how to wrangle and visualize various data types in Python using libraries like Numpy, Pandas, and Matplotlib.
Also how to identify the right visuals and summaries for univariate, multivariate, probability, and non-probability data samples.
By the end, you’ll confidently communicate statistical ideas through data visualizations.
Next up is Inferential Statistical Analysis with Python where you’ll move from summarizing data to making inferences and assessing theories through statistical testing.
Here you will master confidence intervals, hypothesis testing, and interpreting results using real-world case studies.
The specialization culminates in Fitting Statistical Models to Data with Python.
Go beyond inference to fitting versatile statistical models like linear regression, logistic regression, and Bayesian models.
The hands-on projects give you practice generating predictions and discovering insights from real data sets.
The program’s unique blend of conceptual learning and practical coding skills prepares you for data analytics roles or more advanced study.
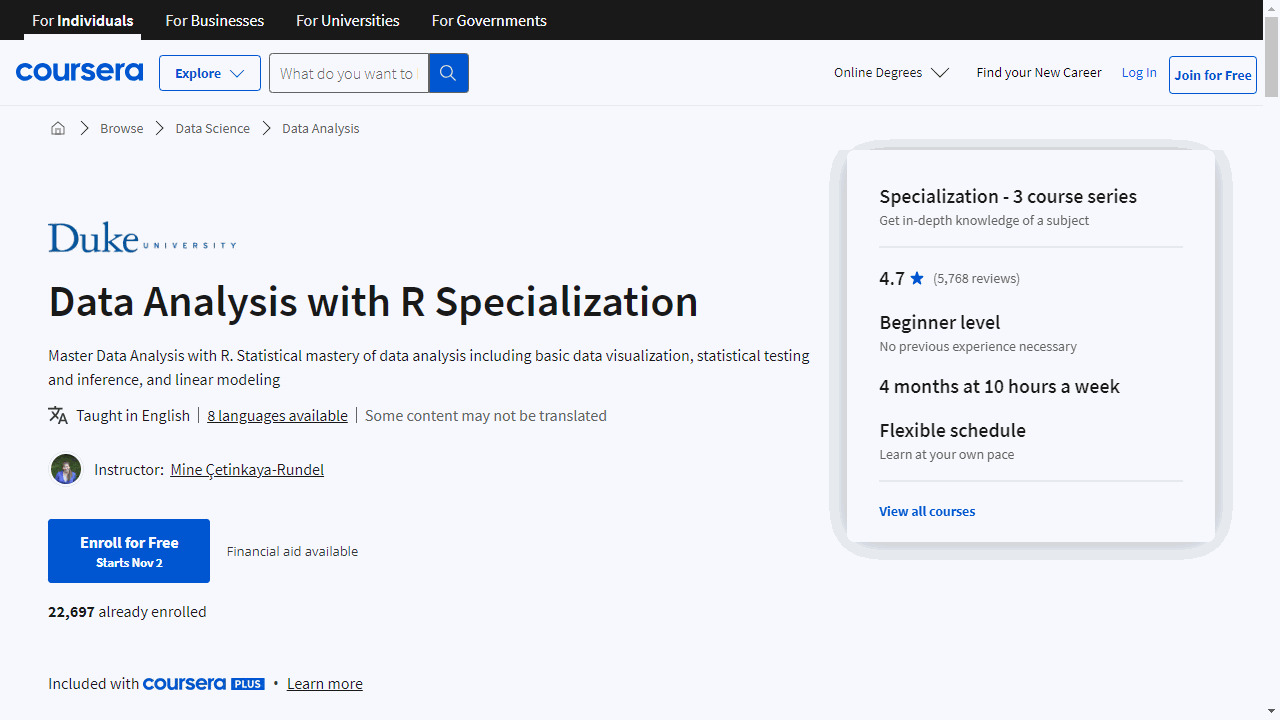
Data Analysis with R Specialization
The first course provides a strong foundation in probability and data exploration.
You’ll learn various sampling methods and how they impact analysis. Get hands-on practice with R and RStudio to build your skills in data visualization and summary statistics. These are key skills that will help you interpret and understand data.
Building on that base, the second course dives into statistical inference methods.
You’ll gain practical experience running hypothesis tests, interpreting p-values, and reporting results. Using real data examples, you’ll learn how to express the uncertainty of estimates.
More work with R will reinforce these concepts so you can apply them in the real world.
The specialization concludes with a course on linear regression modeling.
You’ll discover how to assess relationships between variables in data using simple and multiple linear regression. Can factors like a mother’s characteristics predict her child’s test scores? You’ll find out.
More training with R will give you the tools to fit, examine, and use regression models to unlock insights.
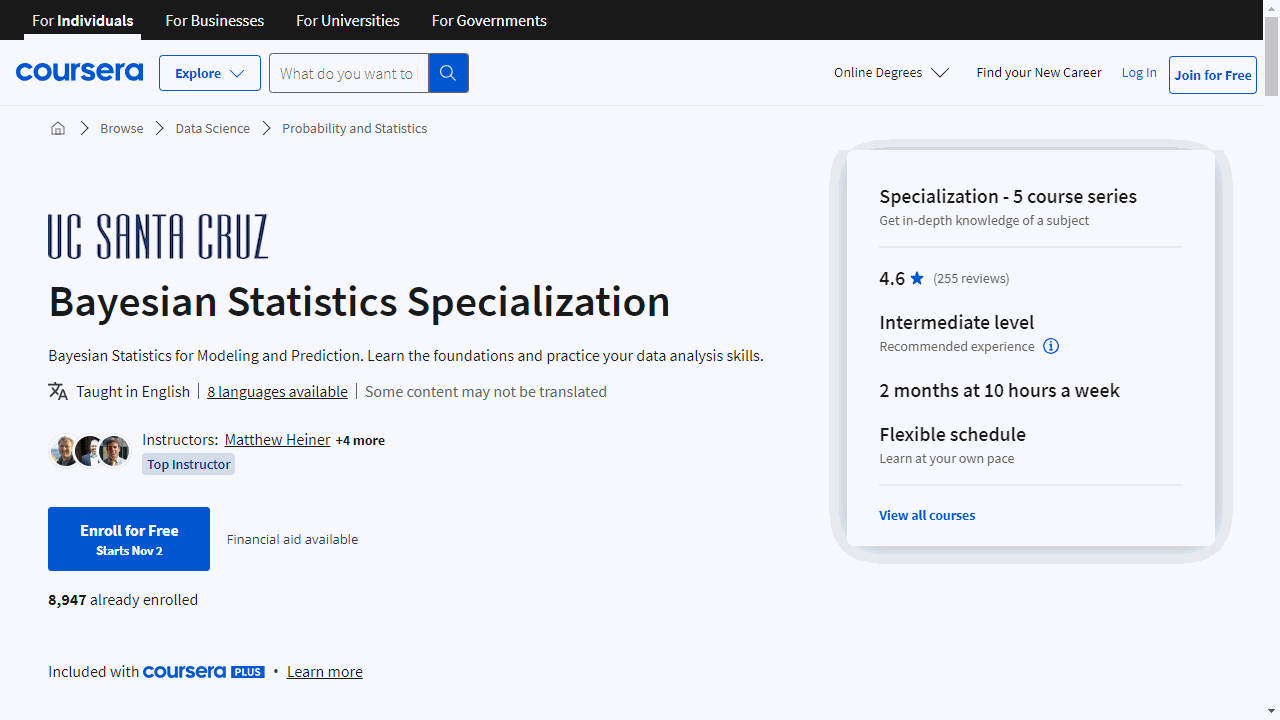
Bayesian Statistics Specialization
This hands-on program takes you from Bayesian statistics fundamentals to advanced techniques over 5 challenging courses.
You’ll start with Bayesian Statistics: From Concept to Data Analysis.
This intro course teaches you the Bayesian philosophy and how to implement Bayesian methods using R or Excel.
You’ll compare Bayesian and frequentist approaches so you understand the benefits of Bayesian statistics for accounting for uncertainty.
Next up is Bayesian Statistics: Techniques and Models, where you’ll expand your Bayesian toolbox.
Here you master Markov chain Monte Carlo methods to sample from complex posterior distributions. You’ll learn to build, fit, assess, and compare Bayesian models for continuous, binary, and count data.
In Bayesian Statistics: Mixture Models, you take on more advanced techniques like using mixture models for classification, clustering, and density estimation. The exercises let you apply what you learn to real examples.
Bayesian Statistics: Time Series Analysis equips you to model temporal dependencies and perform Bayesian forecasting. You implement time series models in R and analyze real data.
Finally, you tie everything together in the Capstone Project.
You demonstrate your new Bayesian skills by performing a complex data analysis and reporting on your methods and results.
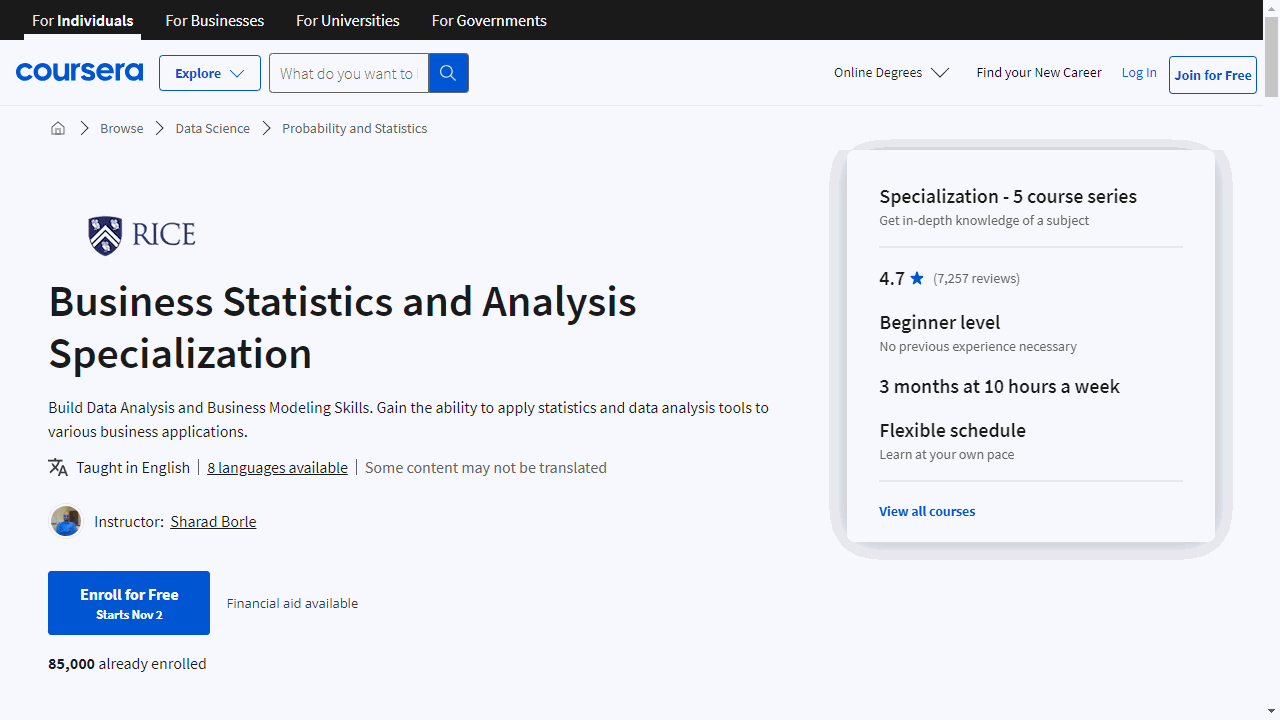
Business Statistics and Analysis Specialization
This is the right specialization if your motivation to learn statistics is to apply it in business cases like marketing, finance, and operations.
You’ll start with Excel training. Master functions to organize and analyze data. Create powerful pivot tables and charts to visualize insights.
Then you’ll learn key statistics concepts. Understand probability distributions like normal and binomial. Calculate percentiles, variance, correlation - everything managers look for.
Next, apply your new skills to hypothesis testing and confidence intervals. Learn to make forecasts backed by rigorous analysis. All examples are business situations you’ll encounter.
The Specialization culminates in a capstone project. You’ll work with real housing data. Mimic an analytics consultant. Showcase statistics, Excel, regression, and more.
Throughout, the focus is practical application. Courses use Excel templates you can reuse at work. Video lectures demonstrate each technique. Knowledge checks test your understanding.
You won’t just read about statistics - you will learn to use it.
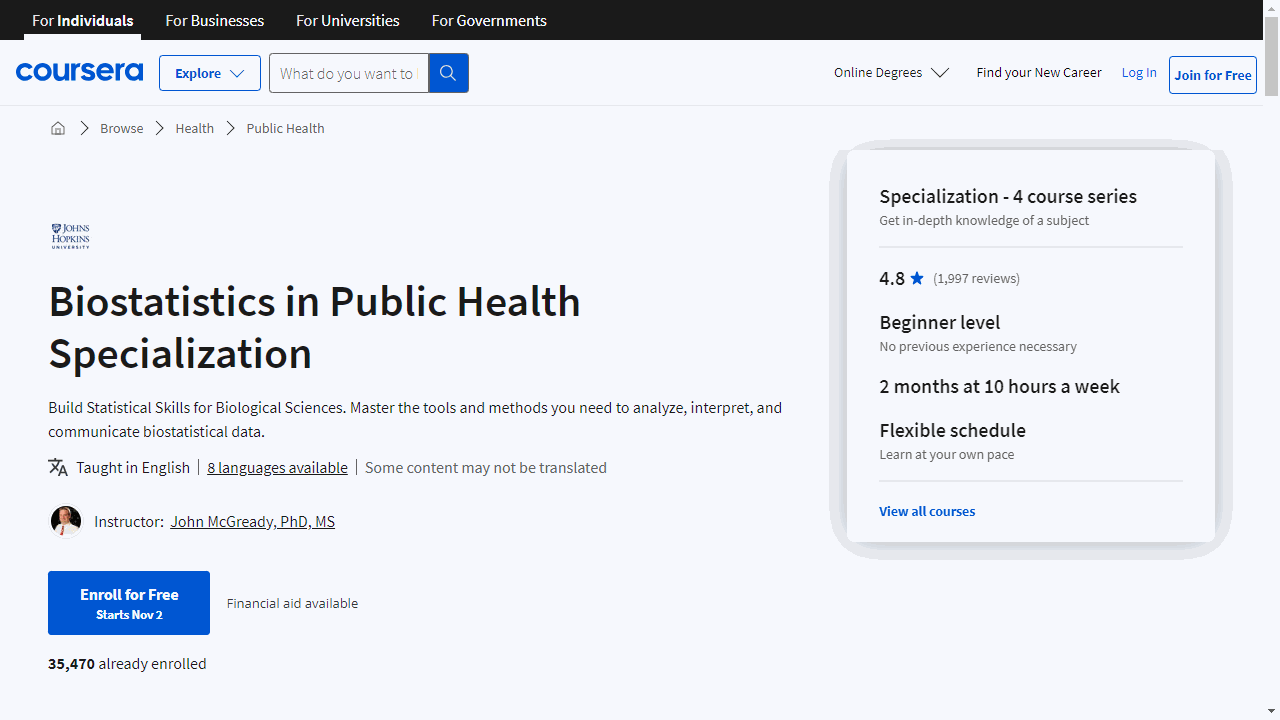
Biostatistics in Public Health Specialization
These statistics courses from Coursera will give you the skills you need to analyze and interpret data in public health research.
The specialization covers everything from summary measures to regression analysis.
The first course teaches you statistics basics like calculating summary measures and visualizing data.
You’ll get hands-on practice analyzing real published studies. By the end, you’ll be able to interpret data visualizations and summarize continuous and binary data.
The second course focuses on hypothesis testing and sampling methods.
You’ll learn to evaluate sample variability and calculate confidence intervals. This allows you to make statistical inferences from samples to whole populations. You’ll also master p-values for hypothesis testing.
The third course introduces simple linear regression.
You’ll determine the relationship between an outcome and a single predictor. This is key for modeling how variables impact each other. You’ll also learn to recognize confounding factors that distort statistical analysis.
The fourth course expands on regression analysis with multiple predictors.
You’ll predict an outcome based on several variables, which is crucial for public health research. The course also covers advanced regression techniques like splines and adjustments.
With these comprehensive courses, you’ll gain an in-demand skillset for public health.
The focus on practical data analysis skills prepares you to interpret and conduct statistical research.
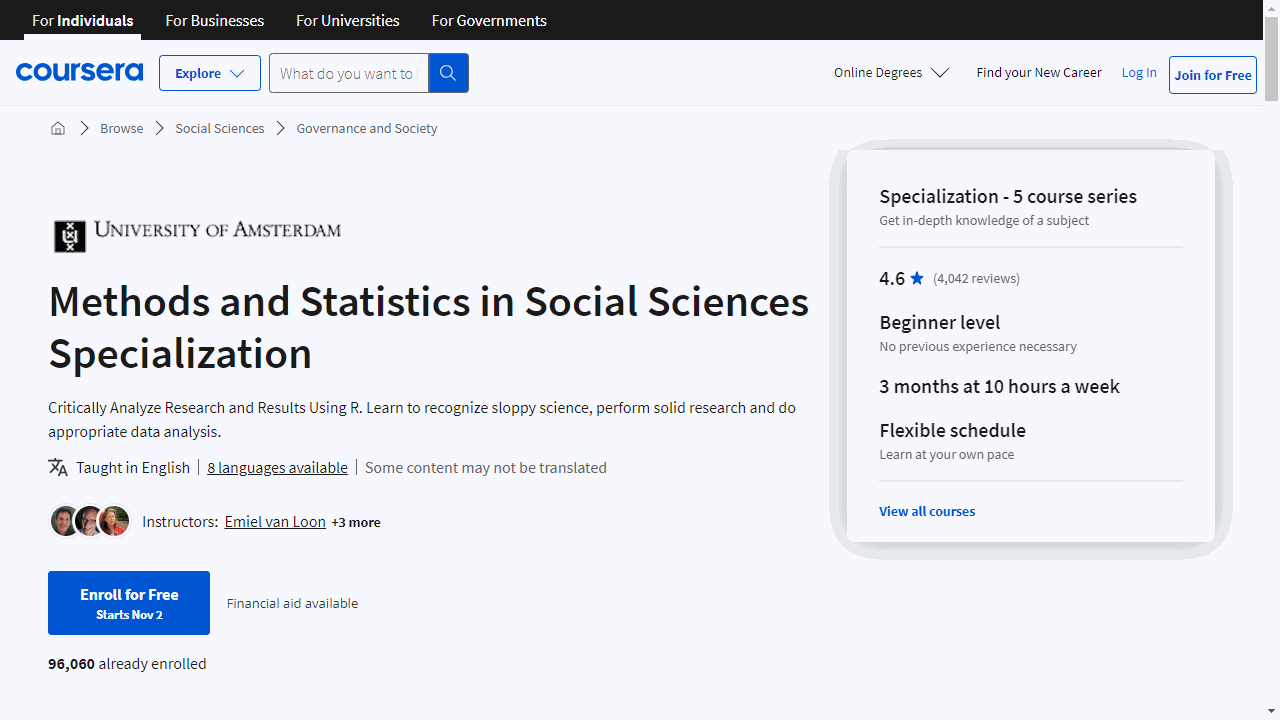
Methods and Statistics in Social Sciences Specialization
Want to take your social science research to the next level?
Look no further than Coursera’s Methods and Statistics in Social Sciences Specialization.
This hands-on program will give you the statistical tools and knowledge needed to conduct rigorous quantitative and qualitative studies.
You’ll start by learning the fundamentals of scientific research. From day one, you’ll be separating sloppy science from solid studies.
Next, you’ll master descriptive statistics - calculating measures of central tendency (like means), standard deviations, correlations, and more.
This will prepare you for inferential statistics, where you’ll learn to draw conclusions about populations based on sample data.
The Specialization also covers crucial qualitative methods.
You’ll discover how to collect and analyze interview, observational, and other non-numerical data.
By the end, you’ll be able to design mixed methods studies leveraging the strengths of multiple approaches.
The comprehensive curriculum culminates in a final research project.
This gives you the chance to apply everything you’ve learned. You’ll formulate hypotheses, design experiments, collect and analyze data, and document your results.
It’s an invaluable experience that will boost your research skills for years to come.
Throughout the Specialization, you’ll use real statistical software like R.
This ensures you gain practical skills essential for social science careers.
The courses also promote research integrity so you’ll know how to conduct ethical, high-quality studies.
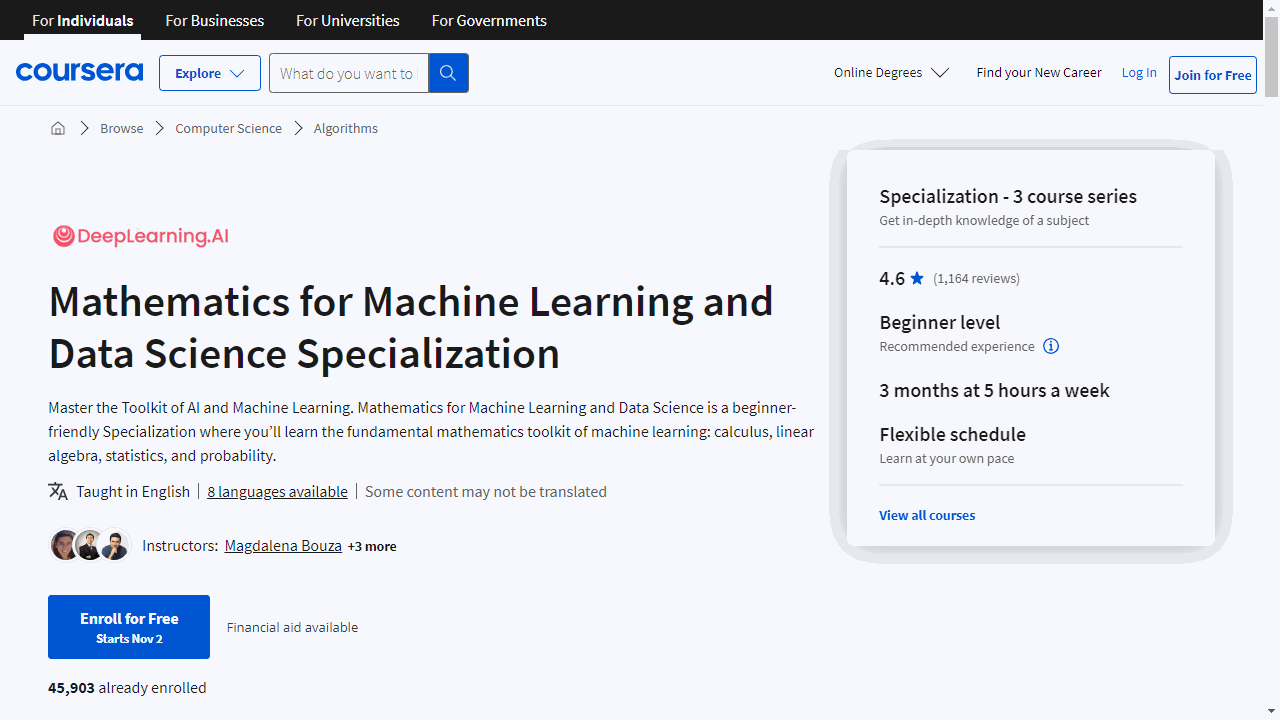
Mathematics for Machine Learning and Data Science Specialization
If your motivation to learn statistics is to get a career in machine learning or data science, this beginner-friendly Coursera Specialization is perfect for you.
Created by DeepLearning.AI, these courses use innovative teaching methods to help you master math intuitively and quickly.
Easy-to-follow plugins and visualizations show you exactly how the math behind machine learning works.
The first course covers core linear algebra concepts like vectors, matrices, eigenvalues, and eigenvectors.
You’ll learn how to represent data and identify key properties that are crucial for machine learning algorithms. Hands-on Python labs cement your learning.
Deep learning heavily relies on linear algebra, so this course is a must for aspiring data scientists.
Up next is calculus, where you’ll become an expert at analytical and numerical optimization. Master techniques like gradient descent and Newton’s method by optimizing ML functions visually and conceptually.
Finally, get rock solid in probability and statistics.
Grasp uncertainty and easily understand distributions like Bernoulli and Gaussian. Apply essential statistical methods to real ML problems, like maximum likelihood estimation. Evaluate model performance with statistical testing.
By the end, you’ll have the exact math toolkit needed for the latest ML algorithms and data analysis.
The focus is true beginner level, with high school math background recommended. Python familiarity helpful too.
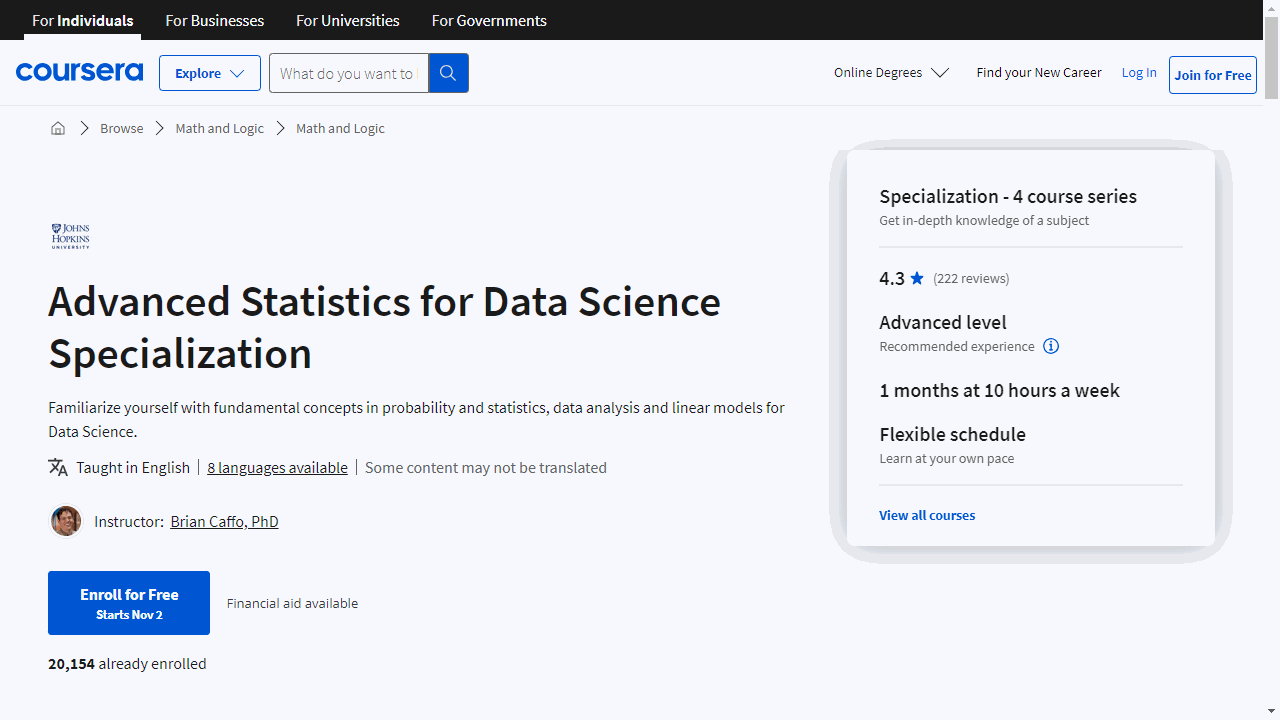
Advanced Statistics for Data Science Specialization
I took the courses in this specialization when they first launched, so they have a special place in my heart, although I believe the specializations above are more up-to-date and better structured.
The Mathematical Biostatistics Boot Camps provide a robust foundation in statistical analysis and probability theory.
You’ll gain proficiency in fundamental biostatistical methods like confidence intervals that data scientists rely on.
Building on that base, the Advanced Linear Models courses take you deeper into the math and theory underlying regression modeling.
You’ll gain linear algebra and calculus skills to thoroughly understand these pivotal data science techniques.
Through a blend of proofs, theory, and hands-on R programming, these linear model courses strengthen your applied stats abilities. You’ll be able to leverage regression models and methods with new rigor and expertise.
Even though it says “Biostatistics” in the title, this Specialization develops the advanced statistical chops today’s data science roles demand.
You’ll master techniques like hypothesis testing, regression modeling, and more with mathematical rigor.
