Tableau is a powerful data visualization tool that has become increasingly popular in recent years.
It allows users to connect to various data sources, create interactive dashboards, and share their insights with others.
Learning Tableau can open up a wide range of career opportunities in fields such as business intelligence, data analytics, and data science.
Whether you’re a business professional, a student, or simply someone who wants to learn more about data visualization, Tableau is a valuable skill to have.
Finding a good Tableau course can be challenging, especially with the abundance of options available online.
You want a course that is comprehensive, engaging, and taught by experienced instructors who can guide you through the intricacies of the software.
It should cover both the fundamentals and advanced techniques, and provide you with hands-on practice to solidify your understanding.
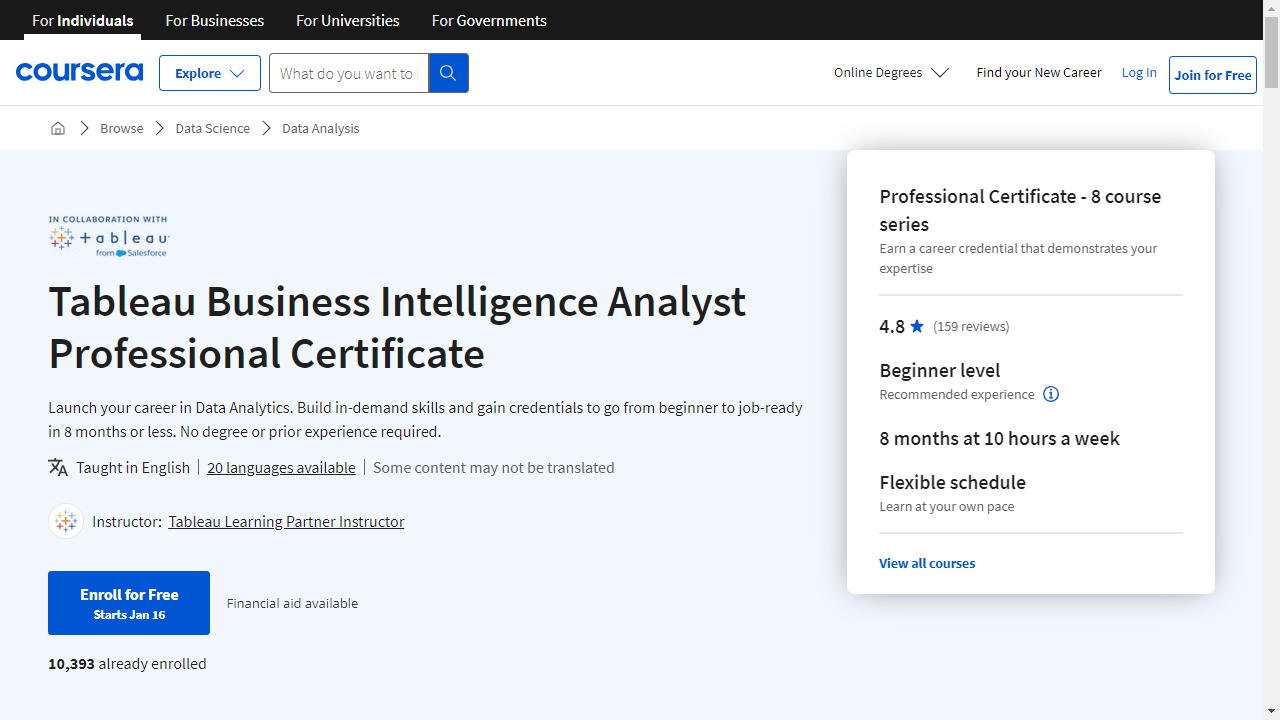
Based on our research and analysis, we consider the Tableau Business Intelligence Analyst Professional Certificate on Coursera to be the best Tableau course overall.
This comprehensive program covers everything from the basics of business analysis to advanced data visualization techniques in Tableau.
It provides a strong foundation in both the theoretical and practical aspects of Tableau, and prepares you for a career as a business intelligence analyst.
While the Tableau Business Intelligence Analyst Professional Certificate is our top recommendation, there are other excellent Tableau courses available that cater to different learning styles and preferences.
Continue reading to explore our curated list of the best Tableau courses, including options for beginners, intermediate learners, and those seeking specialized skills.
Tableau Business Intelligence Analyst Professional Certificate
Provider: Coursera
This Tableau Business Intelligence Analyst Professional Certificate on Coursera equips you with the essential skills needed to thrive in the world of business analytics.
You’ll embark on your journey by mastering the fundamentals of business analysis, learning how to effectively collaborate with stakeholders, gather and document requirements, and transform intricate processes into clear visual models.
Next, you’ll delve into the heart of the data ecosystem, gaining a comprehensive understanding of various data sources such as databases and data warehouses.
You’ll discover the critical role of data governance and quality in maintaining a robust and reliable data infrastructure.
This foundation will prepare you to harness the power of Tableau Public, a leading data visualization tool.
You’ll learn to prepare data, combine information from various sources, and construct compelling visualizations that transform raw data into insightful narratives.
As you progress, you’ll explore advanced data visualization techniques, mastering the art of dual-axis charts, bar-in-bar charts, and small multiples to craft sophisticated and impactful visuals.
You’ll even discover how to incorporate spatial analytics, including geocoding and map-based visualizations, to uncover hidden geographical patterns and trends.
The program culminates by teaching you how to perform sophisticated data analysis using Tableau, going beyond manual calculations to leverage the platform’s powerful analytical capabilities.
Tableau A-Z: Hands-On Tableau Training for Data Science
Provider: Udemy
This Tableau course on Udemy takes you from the basics of creating your first bar chart to mastering advanced techniques like table calculations and data blending.
You begin by learning how to connect Tableau to your data, whether it’s a simple CSV file or a more complex spatial file.
You’ll master essential skills like creating calculated fields, adding colors and labels, and formatting your visualizations for maximum impact.
The course then guides you through more advanced visualizations such as maps, scatter plots, and your very first interactive dashboard.
You’ll learn about different types of joins – left, right, inner, and outer – essential for combining data from multiple sources.
You’ll even dive into the powerful technique of data blending, allowing you to combine data in ways that traditional joins can’t handle.
As you progress, you’ll discover how to create insightful table calculations, build advanced dashboards with interactive elements, and craft compelling storylines that communicate your data’s message effectively.
You’ll learn to prepare your data for analysis, from simple tasks like pivoting and splitting columns to tackling more challenging issues like fixing geographical data errors.
The course also equips you with the ability to group data into custom territories, apply clustering techniques to uncover hidden patterns, and even connect to cross-database joins for broader data exploration.
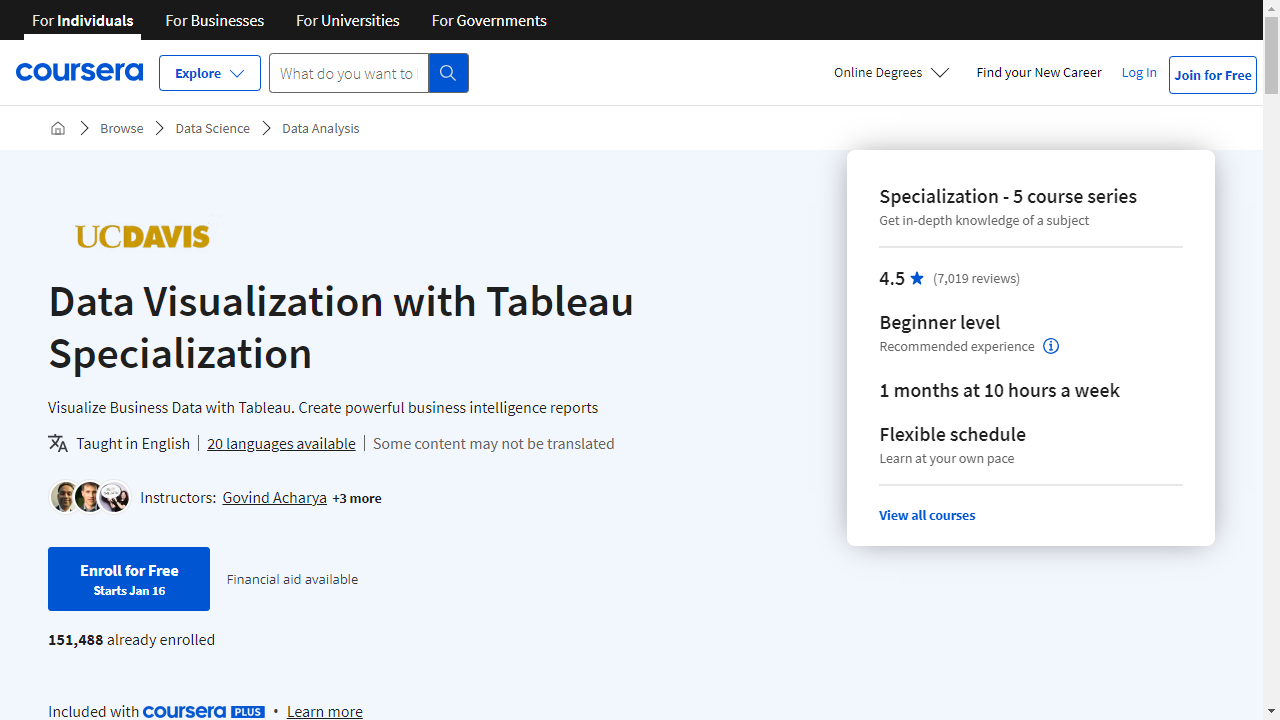
Data Visualization with Tableau Specialization
Provider: Coursera
This specialization equips you with the skills to transform data into insightful visuals using Tableau.
You will begin with the fundamentals of data visualization, learning how to navigate Tableau Public, import data, and define your project goals.
You’ll quickly progress to designing compelling visualizations, understanding how to select the most effective chart types — like scatter plots for relationships or Gantt charts for timelines — and employ design principles for clarity and impact.
The course then delves into advanced Tableau functionalities, such as crafting interactive visualizations and using calculated fields.
You’ll master techniques to create custom table calculations, incorporate geographical data into maps, and design dynamic dashboards.
This practical experience prepares you to transform raw data into interactive stories.
You will then learn to weave narratives from data, identifying key insights and presenting them in a clear and compelling way.
You’ll use Storypoints, a powerful Tableau feature, to build presentations that resonate with your audience.
This narrative-driven approach ensures that your data insights leave a lasting impression.
Finally, you’ll apply everything you’ve learned in a capstone project.
This project allows you to demonstrate your mastery of Tableau by creating a portfolio-ready data visualization or story to share publicly.
This hands-on project solidifies your skills and provides tangible evidence of your expertise in data visualization with Tableau.
Tableau Advanced: Master Tableau in Data Science
Provider: Udemy
This Tableau Advanced course takes you beyond the basics to become a data visualization expert.
You’ll learn how to use Groups and Sets, allowing you to create dynamic and interactive dashboards that adapt to your specific needs.
Imagine being able to effortlessly categorize and filter data to uncover hidden patterns and trends.
You’ll master advanced table calculations, a powerful technique for performing complex calculations and manipulating data within Tableau.
You’ll go beyond simple aggregations and learn how to create moving averages for time series analysis, helping you unlock deeper insights from your data.
You’ll discover techniques for handling large datasets, building box plots to visualize data distribution, and using time series analysis for making predictions.
The course will teach you how to build engaging and dynamic dashboards that capture attention and make complex data easy to understand.
You’ll also dive into Level of Detail (LOD) calculations, which give you precise control over the level of detail in your analysis.
You’ll be able to see the big picture while also having the ability to drill down into specific aspects of your data.
Finally, you’ll explore advanced mapping techniques that will allow you to create stunning visualizations that tell a story about your data geographically.
Imagine being able to present your findings on interactive maps that showcase trends, patterns, and insights in a visually compelling way.
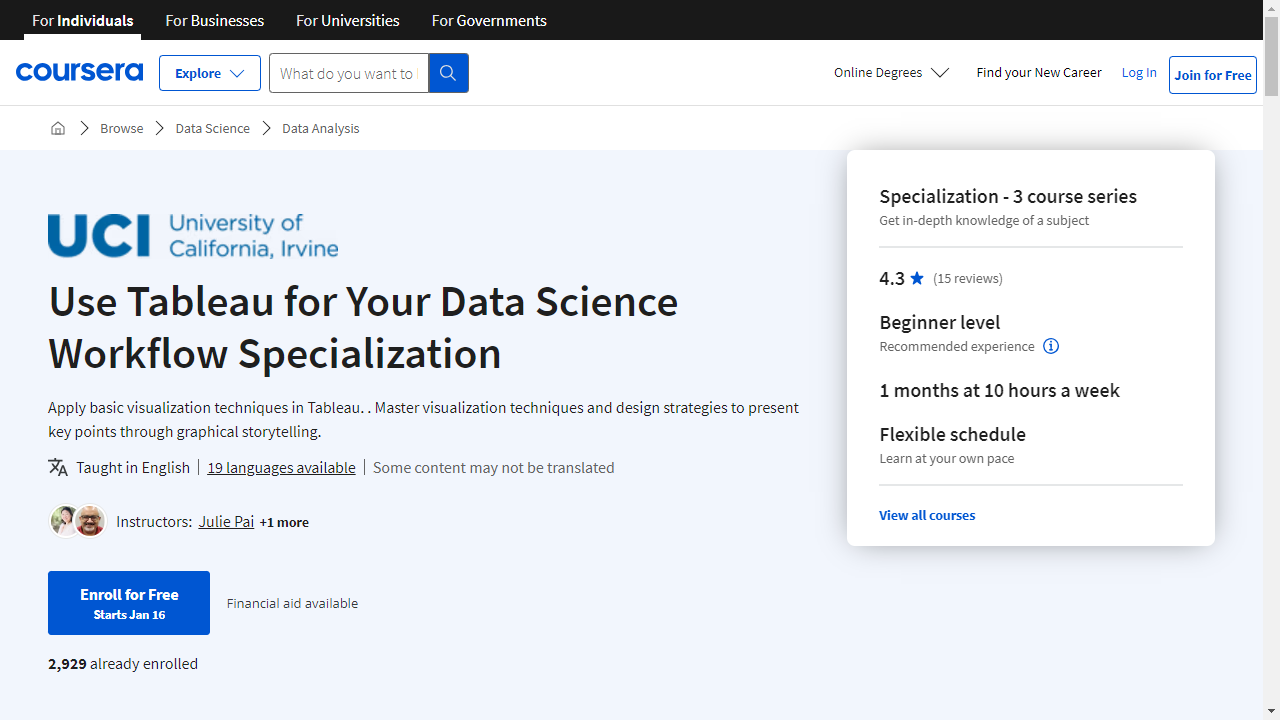
Use Tableau for Your Data Science Workflow Specialization
Provider: Coursera
This specialization equips you with the skills to integrate Tableau into your data science workflow.
You begin by mastering the fundamentals of data visualization, understanding its role in data science, and employing design principles to craft effective visualizations.
You establish your Tableau environment, practice data loading, and conduct basic analysis of the S&P 500 stock sectors.
You then transition to the intricacies of data storytelling, exploring the interplay between visual elements and data comprehension.
You learn to weave compelling narratives from data using Tableau, while also understanding how to sidestep common visualization pitfalls that can lead to misrepresentation.
This course utilizes the S&P 500 stock sectors for practical application, allowing you to delve deeper into multivariate analysis.
Finally, you elevate your Tableau expertise by mastering the art of dashboard creation.
You acquire best practices for designing informative and engaging dashboards and learn to publish your work for broader access.
The course also provides insights into advanced visualization techniques.
You culminate your learning journey by developing an information layout showcasing the most significant gainers and losers in the financial markets, comparing these trends to economic data as your capstone project.
Tableau Certified Data Analyst: Top Exam Prep Course
Provider: Udemy
The course begins with a straightforward installation of Tableau Public, the free version of Tableau Desktop.
You’ll jump into the basics, understanding the difference between measures and dimensions, and discovering how to leverage discrete and continuous fields and Tableau-generated fields.
As you progress, you’ll master various chart types, from histograms and heat maps to bar charts and scatter plots.
You’ll even tackle more advanced visualizations like box-and-whisker plots and dual-axis charts.
Don’t worry; the course doesn’t just throw you into the deep end.
You’ll learn how to present data effectively using titles, captions, and tooltips.
You’ll also discover the power of mapping in Tableau, importing custom geocoding, blending geographic data, and even working with background image maps.
You’ll become proficient in organizing and simplifying your data using techniques like sorting, filtering, and creating groups, sets, and hierarchies.
The course delves into various calculations, including aggregate functions, ratio calculations, and working with dates.
You’ll even master the intricacies of Level of Detail (LOD) expressions, a powerful tool for advanced analysis.
You’ll gain a thorough understanding of data connections, learning to combine tables using SQL joins, blends, and relationships.
The course culminates with a deep dive into dashboards, trendlines, and forecasting – all essential skills for data analysts.
You’ll get ample opportunity to test your knowledge with practice exams that closely mirror the actual certification exam.
Tableau Data Analyst/Specialist Desktop Certification
Provider: Udemy
This Udemy course equips you with the skills needed to become a proficient Tableau Data Analyst or Specialist.
You begin with the fundamentals, learning to create basic charts like bar charts, line charts, and scatter plots, and then progress to crafting intricate dashboards that transform data into captivating stories.
You discover how to use the Marks card to customize your visualizations, wield filters effectively, and even incorporate maps for geographical data representation.
Don’t worry, this course doesn’t shy away from advanced techniques.
You delve into LOD calculations, a powerful tool for performing granular calculations, and master the art of data blending to combine data from multiple sources.
You also become proficient in connecting to various data sources, including databases, and harness the power of Tableau Prep to clean and prepare your data for analysis.
The course covers both Tableau Desktop and Tableau Online, giving you a well-rounded understanding of the Tableau ecosystem.
You learn how to publish your impressive visualizations, schedule automatic data extract refreshes, and even set up subscriptions and alerts to stay informed about your data.
Also check our posts on:


