Tableau A-Z: Hands-On Tableau Training for Data Science
The course starts by getting you set up with Tableau and the necessary datasets.
Then, it dives into the basics of creating visualizations like bar charts, adding colors and formatting.
From there, it covers more advanced topics like working with time series data, understanding aggregation and level of detail, and creating filters.
You’ll learn how to make maps, scatter plots, and dashboards with interactive actions.
The course goes deep into joining and blending data from multiple sources, as well as using the new relationships feature in Tableau 2020.2.
It teaches you how to create dual-axis charts and calculated fields within blends.
You’ll master table calculations, parameters, tree maps, and customer segmentation dashboards with advanced interactivity.
It even covers data prep tasks like pivoting, splitting columns, and fixing geographic data issues.
Later sections cover advanced topics like creating custom territories, clustering, cross-database joins, modeling with clusters, and new mobile design features.
You’ll learn the latest Tableau capabilities for connecting to PDFs and spatial files, step/jump line charts, and tooltips with vizzes.
The course wraps up with a roadmap for continued learning.
Tableau Advanced: Master Tableau in Data Science
This comprehensive syllabus covers a wide range of advanced topics in Tableau, equipping you with the skills to tackle complex data analysis and visualization challenges.
You’ll start by diving into groups and sets, learning how to work with them, create static and dynamic sets, combine sets, and control them with parameters.
This section culminates in building a dashboard showcasing startup data, complete with tricks to enhance its functionality.
Next, you’ll explore advanced table calculations, a powerful feature in Tableau.
You’ll learn how to create multiple joins, differentiate between calculated fields and table calculations, and specify the direction of computation.
Additionally, you’ll gain hands-on experience in writing your own table calculations, adding a second layer moving average, and ensuring quality assurance for these calculations.
The course then delves into advanced data preparation and analytics within Tableau.
You’ll build box plots, analyze them, and work with large data sources.
Pivoting and splitting data will become second nature, and you’ll learn how to apply data source filters effectively.
Real-world retail scenarios will be explored, and you’ll master trendlines, data preparation exercises, advanced time series blending, and even forecasting in Tableau.
Creating animations in Tableau is another key skill you’ll acquire.
You’ll edit blending relationships, build visualizations, add animations, manually sort blended data, and leave a trail in your animations, culminating in a polished dashboard.
Level of Detail (LOD) calculations, a powerful feature in Tableau, will be demystified.
You’ll gain an intuitive understanding of LOD calculations, learn about the different types (INCLUDE, EXCLUDE, and FIXED), and explore how to use multiple fields in these calculations.
Advanced mapping techniques are also covered, including working with polygons, background maps, and solving business challenges using maps.
You’ll learn how to use the drawing tool for Tableau, add custom images to maps, calculate distances, and customize maps with Mapbox.
Throughout the course, you’ll work on real-world projects, ensuring you gain practical experience in applying the concepts you’ve learned.
By the end, you’ll have a solid grasp of advanced Tableau techniques, positioning you as a skilled data analyst or data scientist.
Tableau Certified Data Analyst: Top Exam Prep Course
The course starts by introducing you to Tableau Public, the free version of Tableau Desktop.
You’ll learn how to install it on Windows and get a first-hand look at the interface.
From there, it dives into the fundamentals - understanding the difference between measures and dimensions, discrete and continuous fields, and how to utilize Tableau-generated fields.
You’ll then explore various chart types like histograms, heat maps, bar charts, line graphs, scatter plots, and the powerful box-and-whisker plots for visualizing distributions.
Along the way, you’ll work on hands-on questions using real datasets to solidify your understanding.
Mapping is a crucial aspect, and you’ll learn how to navigate maps, handle ambiguous locations, measure distances, and even blend geographic data or use custom image maps as backgrounds.
As you progress, you’ll discover techniques to organize and simplify data using sorting, filtering, grouping, sets, and hierarchies.
The course dedicates an entire section to calculations - from basic aggregations to ratios, date calculations, string functions, and advanced table calculations like running totals and moving averages.
You’ll dive deep into level of detail (LOD) expressions, a powerful tool for controlling the granularity of your calculations.
Multiple hands-on exercises will help you master LOD expressions like FIXED and EXCLUDE.
Data connections are equally important, and you’ll learn how to combine data from multiple sources using SQL joins (inner, outer, left, etc.), unions, blending, and relationships.
You’ll also explore data interpreter, pivoting, and splitting techniques.
Once you have your data ready, you’ll learn to create interactive dashboards by combining multiple worksheets.
The course then covers advanced analytics like trendlines (with statistical measures like p-values and r-squared) and forecasting.
To prepare you for the certification exam, the course includes three full-length practice exams with both knowledge-based and hands-on lab questions.
Additionally, you’ll work through several problem sets modeled after the actual exam questions.
Finally, you’ll learn how to create a portfolio of visualizations on Tableau Public, using publicly available data sources like government websites and Twitter data.
This can be a great way to showcase your skills to potential employers.
Throughout the course, you’ll have access to datasets, study guides, and video solutions to the hands-on questions, ensuring you have all the resources you need to master the concepts.
Tableau Data Analyst/Specialist Desktop Certification
You’ll start by learning the basics of Tableau’s user interface, dimensions vs. measures, and how to publish and export your visualizations as images, PDFs, or PowerPoint presentations.
As you progress, you’ll dive into developing the Marks card, creating scatter plots, bubble charts, and using the data highlighter and filters.
You’ll master the Pages shelf, adding labels and annotations, and creating interactive dashboards optimized for different devices.
Get ready to impress with your map skills, including density maps, layering, and geographic search.
You’ll also learn to organize and simplify data using hierarchies, groups, and sets.
Explore advanced chart types like histograms, heat maps, and tree maps, along with basic analytics like trend lines and forecasting.
The real power comes with calculations - you’ll build logic statements, manipulate strings and dates, create predictive models, and even work with parameters.
Prepare to level up with fixed Level of Detail (LOD) calculations and dynamic parameters.
Data connections are key, and you’ll learn to join tables from multiple sources, use custom SQL queries, create extracts, and even connect to spatial files.
Plus, you’ll get hands-on with Tableau Prep for creating data flows.
2024 Tableau Certified Data Analyst Training
This comprehensive course covers everything from the fundamentals to advanced techniques, equipping you with the skills to become a Tableau pro.
The course begins with an “Accelerator Program” that provides a 1-hour quick start guide.
You’ll learn how to load data into Tableau, create basic visualizations like bar charts and scatter plots, and build your first dashboard.
This section is perfect for beginners, allowing you to grasp the core concepts quickly.
As you progress, the course dives into more advanced topics.
The “Beginner” section teaches you data control, preparation techniques like grouping, sorting, and aggregations.
You’ll also learn essential skills like filtering dates, measures, and strings, as well as creating visualizations like maps and density plots.
The “Intermediate” section focuses on project management, data cleansing, and preparation.
You’ll explore numerical and text-based cleansing techniques, work with pivots and table structures, and master mathematical operators and logic analysis using IF functions.
Additionally, you’ll learn about date-based analysis, quick table calculations, and advanced filtering and mapping techniques.
The “Expert” section is where you’ll truly elevate your skills.
You’ll dive into unions, joins, and blending data from multiple sources.
You’ll also learn to create interactive dashboards using parameters, sets, and level of detail calculations.
The course covers advanced analytics, including trendlines, forecasting, and clusters.
Moreover, you’ll explore dashboard design elements, objects, and actions, enabling you to create visually stunning and interactive dashboards.
Throughout the course, you’ll work with real-world datasets and complete hands-on assignments, solidifying your understanding.
The instructor provides clear explanations, practical examples, and step-by-step guidance, ensuring you grasp each concept thoroughly.
One of the standout features of this course is its focus on career development.
The instructor shares insights on project management methodologies, mindset for success, and strategies to become a highly sought-after data analyst earning a six-figure income.
Master Course in Tableau for Business Intelligence
The course starts with the basics, guiding you through installing Tableau and connecting to data sources, including open data from the UK government.
You’ll learn to build essential visualizations like bar charts, box and whisker plots, and maps, while mastering features like filters, tooltips, and formatting.
As you progress, the syllabus dives into intermediate concepts like time series analysis, trend forecasting, and data blending – a powerful technique for leveraging multiple data sources.
You’ll also explore calculated fields, table calculations, and how to create visuals like tree maps and stacked bars.
But the real test comes in Stage 3, where you’ll build three linked dashboards from scratch, putting all your newfound skills into practice.
This hands-on project will have you creating intricate visualizations, formatting dashboards, and implementing advanced navigation with actions and filters.
Along the way, you’ll discover handy features that streamline your workflow, such as hierarchies for organizing data fields, bins for grouping data, and pivot functionality.
Plus, you’ll learn how to create eye-catching visuals like Gantt charts, waterfall charts, and even word clouds.
For those aiming for professional certification, the course prepares you for the Tableau Qualified Associate Exam and provides tips on showcasing your skills to potential employers.
And if that’s not enough, bonus lectures cover advanced topics like custom color palettes, shapes, and Level of Detail (LOD) expressions – perfect for taking your Tableau game to the next level.
The Complete Tableau Bootcamp for Data Visualization
You’ll start by learning the fundamentals of data visualization and how to get started with Tableau.
The course then dives into visual analytics, covering essential concepts like data types, aggregation, granularity, and preattentive visual properties like length, color, shape, and size.
You’ll apply these principles using Tableau to create effective visualizations.
A major focus is on mapping and location data.
You’ll learn how to work with geographical data, create maps, use spatial files, pivot data, and even visualize origin-destination flows.
The course emphasizes finding and working with real spatial datasets.
To ensure your visualizations are accessible, there’s a chapter dedicated to color vision deficiency and making your visuals color-blind friendly.
The real meat is in the advanced calculations section, where you’ll master basic calculations, table calculations, and the powerful level of detail (LOD) expressions in Tableau.
You’ll tackle increasingly complex scenarios using LODs.
Finally, you’ll learn to build interactive dashboards and stories in Tableau to present your visualizations effectively.
Advanced dashboard projects let you put all your skills together in real-world examples.
Throughout, you’ll work with diverse datasets like World Cup data, climate data, sales data and more.
The course covers recent Tableau updates and has specific guidance for Linux users too.
Tableau Desktop Specialist Certification Exam Prep 2024
The course starts with an introduction, covering the important exam update details and tips to make the most of the learning experience.
You’ll also get familiar with the Udemy interface and learn how to download the necessary course materials, including Tableau software, datasets, workbooks, and study guides.
Additionally, you can join the Discord server to connect with fellow learners and get support.
Next, you’ll dive into understanding fundamental Tableau concepts like the interface, data types, dimensions, measures, aggregations, and the new features in recent versions.
A quiz at the end of this section will help reinforce your understanding.
The meat of the course lies in the “Connecting to and Preparing Data” chapter.
Here, you’ll learn about live connections versus extracts, creating joins, unions, blends, renaming fields, and using aliases.
The new relationships feature and Tableau Data Model are also covered in detail, along with practical exercises.
Once you’ve mastered data preparation, you’ll explore various visualization types like bar charts, line charts, scatter plots, maps, and more.
The course teaches you tricks to create any chart efficiently and covers advanced techniques like creating groups, sets, hierarchies, filters, sorting, and calculated fields.
Another quiz follows to test your visualization skills.
The “Sharing Insights” chapter focuses on enhancing your visualizations with fonts, colors, animations, and creating effective dashboards and stories.
You’ll also learn how to optimize layouts for different devices and add interactivity with dashboard actions.
To keep up with the latest exam updates, the course includes sections on Tableau Server, sharing workbooks, exporting options, and creating data sources with multiple connections.
There’s even a bonus lecture on automatic and custom data splitting.
Finally, you’ll have access to a full-length practice exam with theory and hands-on questions, allowing you to assess your readiness for the certification.
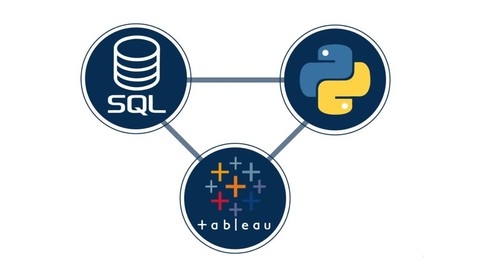
Python + SQL + Tableau: Integrating Python, SQL, and Tableau
You’ll start by understanding the fundamentals of software integration, including data, servers, clients, requests, responses, data connectivity, APIs, and endpoints.
This lays the groundwork for working with different systems.
Next, you’ll set up your working environment by installing Anaconda, a popular Python distribution, and familiarizing yourself with Jupyter Notebooks.
You’ll also learn about installing additional Python packages like scikit-learn (sklearn).
The course then introduces a real-life example of predicting absenteeism at work using a dataset.
This practical approach will help you grasp the concepts better.
A significant portion is dedicated to data preprocessing techniques in Python.
You’ll learn how to handle datasets, remove irrelevant data, split columns into dummy variables, concatenate columns, change column order, and implement checkpoints in coding.
Additionally, you’ll explore techniques like extracting month values from dates and introducing “day of the week” features.
Moving on, you’ll delve into machine learning with Python.
You’ll learn to create targets for logistic regression, select inputs, perform train-test splits, train models, assess accuracy, interpret coefficients, and simplify models using backward elimination.
Saving and deploying machine learning models is also covered.
The course then shifts gears to SQL, starting with installing MySQL and getting acquainted with its interface.
You’ll learn to connect Python and SQL, create databases, import data from Python to MySQL, and run SQL queries from Python.
Finally, you’ll analyze the obtained data using Tableau, a powerful data visualization tool.
You’ll create visualizations to explore relationships between variables like age, reasons for absence, transportation expenses, and the probability of absenteeism.
Throughout the course, you’ll encounter exercises, quizzes, and articles that reinforce the concepts and provide additional context.
Tableau Desktop Specialist Certification Prep
The course starts with an introduction to Tableau, guiding you through the installation process and providing an overview of the Tableau Desktop Specialist exam.
You’ll then dive into the essential downloads, including the study guide and data sets used throughout the course.
One of the key areas covered is connecting to and preparing data.
You’ll learn how to create live connections to data sources, work with extracts, and save metadata properties.
The course also teaches you how to combine data using SQL joins and unions, as well as how to add relationships between data sources.
Exploring and analyzing data is a crucial aspect of Tableau, and the course dedicates a significant portion to this topic.
You’ll learn how to create various chart types, including bar charts, line charts, scatter plots, and combined axis charts.
The syllabus also covers working with geographic data to create maps, as well as using groups, sets, hierarchies, filters, and sorting.
The course delves into advanced techniques like creating reference lines, trend lines, table calculations, bins, and histograms.
You’ll also learn how to create calculated fields and add parameters to your visualizations.
Sharing insights is another essential skill covered in the course.
You’ll learn how to format views for presentation, including using colors, fonts, and shapes.
The syllabus also covers creating and modifying dashboards, adding interactive elements and actions, and creating stories using dashboards or views.
To reinforce your understanding, the course includes quizzes and hands-on practice questions throughout each section, with solutions provided to help you learn from your mistakes.
Additionally, the course covers important Tableau concepts, such as dimensions and measures, discrete and continuous fields, and aggregation.
This theoretical knowledge will help you better understand how Tableau works and make more informed decisions when creating visualizations.
Finally, the course includes three practice exams to help you gauge your readiness for the Tableau Desktop Specialist certification exam.


