Time series analysis is a powerful data analysis technique that focuses on understanding data collected over time, such as stock prices, sales figures, or website traffic.
By learning how to analyze and interpret time series data, you can identify trends, patterns, and seasonality, enabling you to make more informed predictions about future events and optimize your decision-making processes.
Finding the right time series course on Udemy can be a daunting task, with so many options available.
You’re looking for a course that’s comprehensive, engaging, and taught by experts, but also fits your learning style and goals.
For the best time series analysis course overall on Udemy, we recommend Introduction to Time Series Analysis and Forecasting in R.
This course provides a comprehensive introduction to time series analysis, covering everything from the fundamentals to advanced techniques like ARIMA models and neural networks.
The instructor, a seasoned data scientist, delivers clear explanations and engaging lessons that make learning enjoyable and effective.
While Introduction to Time Series Analysis and Forecasting in R is our top pick, there are other great options available.
Keep reading for our full list of recommendations, tailored to different learning levels and areas of focus, including courses on time series analysis in Python, machine learning, and forecasting.
Introduction to Time Series Analysis and Forecasting in R
You’ll begin with an introduction that sets expectations and covers the basics of time series analysis and forecasting methods.
This section also includes an IT store staff allocation use case to illustrate real-world applications.
Next, you’ll dive into working with dates and times in R, a crucial aspect of time series data.
You’ll learn about different date/time classes like POSIXt, Date, and chron, as well as the powerful lubridate package for date/time manipulation and calculations.
The third section focuses on time series data pre-processing and visualization.
You’ll learn how to create time series objects, import data from various sources, handle missing values and outliers, and visualize time series data using charts and graphs like seasonplots.
Then, you’ll explore the statistical background necessary for time series analysis, including stationarity, unit root tests, autocorrelation functions (acf and pacf), and model comparison techniques.
With this foundation, you’ll move on to time series analysis and forecasting methods.
You’ll learn about quantitative models like seasonal decomposition, simple moving averages, and exponential smoothing.
Qualitative methods like judgmental forecasting are also covered.
A major focus is ARIMA (Autoregressive Integrated Moving Average) models, a powerful tool for time series analysis.
You’ll learn automated and manual ARIMA model selection, parameter identification, forecasting, and incorporating external variables.
The course also covers multivariate time series analysis using techniques like Vector Autoregressive (VAR) models and the Granger causality test.
You’ll gain hands-on experience with the relevant R packages.
Additionally, you’ll explore using neural networks for time series analysis, including autoregressive and multivariate neural network models.
Throughout the course, you’ll work with various datasets and complete exercises to reinforce your learning.
Quizzes are included to test your understanding at key points.
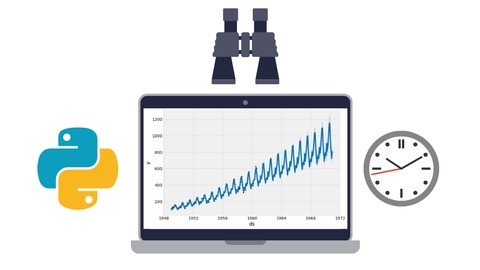
Time Series Analysis in Python

The course starts by setting up the environment with Anaconda and Jupyter, ensuring you have the right tools.
You’ll learn how to load, examine, and plot time series data, handling peculiarities like missing values and datetime formatting.
From there, you dive into core concepts like stationarity, seasonality, and autocorrelation functions to understand data patterns.
The course thoroughly covers various time series models - AR for autoregression, MA for moving averages, ARMA combining both, and the powerful ARIMA for non-stationary data.
You’ll fit these models, analyze residuals, and select optimal parameters.
It also covers volatility modeling with ARCH and GARCH, which are crucial for financial applications.
The auto ARIMA functionality streamlines the model selection process.
You’ll learn forecasting techniques for returns, volatility, and advanced cases like seasonality.
Throughout, you’ll apply concepts using real-world datasets, ensuring practical experience.
The business case on the automobile industry provides an industry-specific perspective.
Time Series Analysis, Forecasting, and Machine Learning

You’ll start by understanding the fundamentals of time series, learning about different types of tasks, data transformations, and evaluation metrics.
The course then dives into exponential smoothing techniques like Simple Moving Average (SMA), Exponentially Weighted Moving Average (EWMA), and Holt-Winters methods, with practical applications in areas like sales data and stock predictions.
Next, you’ll explore the powerful ARIMA (Autoregressive Integrated Moving Average) models, covering stationarity, autocorrelation functions, and model selection criteria like AIC and BIC.
The course also covers Vector Autoregression (VAR) models and Granger Causality, essential for multivariate time series analysis.
The machine learning section introduces supervised learning algorithms like linear regression, logistic regression, support vector machines, and random forests for time series forecasting.
You’ll also learn how to use differencing and apply these techniques to real-world scenarios like stock price predictions and sales forecasting.
The deep learning portion covers artificial neural networks (ANNs), including feedforward networks, convolutional neural networks (CNNs), and recurrent neural networks (RNNs) like LSTMs and GRUs.
These powerful models are applied to tasks like human activity recognition and time series forecasting.
Additionally, the course covers advanced topics like GARCH (Generalized Autoregressive Conditional Heteroskedasticity) models for volatility forecasting and cloud-based forecasting services like AWS Forecast and Facebook Prophet.
Throughout the course, you’ll gain hands-on experience with Python libraries like NumPy, Pandas, Matplotlib, and deep learning frameworks like TensorFlow.
The course also provides guidance on setting up your environment, effective learning strategies, and coding tips to help you succeed.
Time Series Analysis and Forecasting using Python
You will learn the fundamentals of time series forecasting and gain hands-on experience in Python.
The course starts with an introduction to time series forecasting, its use cases, and the steps involved in creating forecasting models.
You’ll then dive into Python basics, covering arithmetic operations, strings, lists, and popular libraries like NumPy, Pandas, and Seaborn.
This lays the foundation for working with time series data in Python.
One unique aspect is the integration of ChatGPT with Python and Jupyter Notebook, allowing you to leverage the power of natural language processing.
The course covers essential time series concepts like data loading, feature engineering, resampling, visualization, and transformation techniques like moving average and exponential smoothing.
You’ll learn about important concepts like white noise, random walk, and decomposing time series.
Moving on, you’ll explore various forecasting models, including naive (persistence) models, auto-regression models (AR), moving average models (MA), and the widely used ARIMA and SARIMA models.
The course guides you through implementing these models in Python, including walk-forward validation techniques.
Additionally, you’ll learn about linear regression, starting with data preprocessing steps like exploratory data analysis, outlier treatment, missing value imputation, and handling categorical variables.
You’ll then dive into model creation, assessing accuracy, and techniques like test-train split and bias-variance trade-off.
The course also introduces you to artificial neural networks (ANN) and their application in forecasting.
You’ll understand perceptrons, activation functions, gradient descent, and backpropagation.
Using Tensorflow and Keras, you’ll build and train neural network models for both classification and regression problems.
Throughout the course, you’ll have access to additional resources, quizzes, and coding exercises to reinforce your learning.
Complete Time Series Analysis With Python

The course starts with an introduction to the Python data science environment and reading data from various sources like CSV, Excel, HTML, and JSON files.
You will learn about preprocessing and visualizing time series data using Pandas.
The course covers essential time series concepts like stationarity, seasonality, and different components through practical examples.
You’ll explore techniques like moving averages, exponential smoothing, Holt-Winters, and ARIMA models for forecasting.
The course also delves into machine learning methods like random forests and deep learning models like MLPs and LSTMs for time series analysis.
You will learn about the Prophet library for “prophetic” forecasting and use Keras for implementing neural networks.
Practical examples include forecasting stock prices, Bitcoin prices, and handling unseen data.
The course covers both theoretical concepts and hands-on implementation using Python libraries like Pandas, Sklearn, and Keras.
You will gain experience working with real-world datasets and learn techniques applicable to various domains.
Applied Time Series Analysis in Python

You’ll begin by learning the building blocks of time series analysis, including basic statistics, autocorrelation, white noise, and stationarity.
This lays the foundation for understanding more advanced models like random walks, moving averages, autoregressive models, and the widely used ARMA and ARIMA models.
The course includes coding exercises and projects to help you apply these concepts practically using Python.
As you progress, you’ll dive into more sophisticated techniques like SARIMA, SARIMAX, and vector autoregressions (VAR, VARMA, VARMAX).
These are essential for handling complex time series data with seasonal patterns and exogenous variables.
The course even covers model selection criteria like the Akaike Information Criterion (AIC) to guide you in choosing the best model.
But that’s not all – the course also explores the cutting-edge deep learning approach to time series forecasting.
You’ll learn about deep neural networks, recurrent neural networks (RNNs), long short-term memory (LSTMs), and convolutional neural networks (CNNs).
An end-to-end project guides you through the entire process, from data exploration to feature engineering and model training.
To top it off, the course introduces you to Prophet, a powerful forecasting tool developed by Facebook.
You’ll apply Prophet to a real-world project, predicting bus ridership in Portland, Oregon, while incorporating holiday effects.
Applied Time Series Analysis and Forecasting with R Projects
The course covers a wide range of time series analysis techniques using R, from basic exponential smoothing models to advanced neural networks.
You’ll start with an introduction to the main R functions used in time series analysis, setting expectations for the course.
Then, you’ll dive into four hands-on projects dealing with different types of data - trending, seasonal, irregularly spaced, and neural network modeling.
In the first project, you’ll work with trending data like the Singapore labor force participation rate.
You’ll learn techniques like the Holt linear trend model, ARIMA, and exponential smoothing, visualizing results with ggplot2.
The second project focuses on seasonal data, using the monthly inflation rates of Germany as an example.
Here, you’ll explore seasonal decomposition, seasonal ARIMA models, and exponential smoothing with ETS models.
Time series cross-validation is also covered.
For irregularly spaced data, like a biotech stock, you’ll scrape data from Yahoo Finance, get it into a regular time series format, and analyze it visually.
Finally, the fourth project dives into neural network modeling for time series forecasting, using interactive Dygraphs for visualization.
You’ll clean the data with tidyr and fit neural net models.
Throughout, you’ll work on real coding projects, importing data, writing scripts with a clear mission, and exploring different forecasting techniques.
The course wraps up with a summary and suggestions for further learning options.
Forecasting Models and Time Series for Business in Python

You’ll start with an introduction to time series forecasting and its importance, setting the stage for the rest of the course.
From there, you’ll dive into popular models like Holt-Winters exponential smoothing, TBATS, ARIMA, and SARIMA.
The course covers key concepts like stationarity, seasonality, and handling exogenous variables.
But it doesn’t stop at traditional methods.
You’ll also explore cutting-edge techniques like TensorFlow’s Structural Time Series models and Facebook’s Prophet library.
The course even touches on ensemble methods, combining multiple models for improved accuracy.
Throughout the course, you’ll work with real-world datasets and learn how to preprocess, visualize, and evaluate your forecasts.
The hands-on approach with Python coding exercises solidifies your understanding.
One standout feature is the inclusion of advanced techniques like XGBoost for forecasting.
By combining Prophet with XGBoost, you’ll learn how to leverage the power of machine learning for time series predictions.
Forecasting and Time Series Analysis in Tableau

You’ll start by learning the fundamentals of working with time series data in Tableau, including how to choose the right data roles, track changes over time, and create smoother visualizations using techniques like moving averages.
As you progress, you’ll dive deeper into advanced time series analysis concepts like creating custom forecasting lines, calculating differences between time periods, and using relative date filtering to analyze specific date ranges.
The course also covers Tableau’s built-in forecasting toolbox, teaching you how to understand and customize different forecast models.
But what really sets this course apart is its focus on integrating R with Tableau for more advanced forecasting techniques.
You’ll learn how to connect Tableau to R, write R code within Tableau for exponential smoothing, and implement powerful ARIMA models for time series forecasting.
This hands-on experience with R integration is invaluable for taking your time series analysis skills to the next level.
Throughout the course, you’ll work on practical exercises and case studies, ensuring you can apply what you’ve learned to real-world scenarios.
Also check our posts on: