Business intelligence (BI) is the process of collecting, analyzing, and interpreting data to help businesses make better decisions.
BI professionals are in high demand, as companies increasingly rely on data-driven insights to improve their operations, optimize their marketing campaigns, and gain a competitive advantage.
By learning BI, you can gain valuable skills that are applicable to a wide range of industries and roles, from data analyst to business consultant.
Finding the right business intelligence course on Coursera can be a daunting task, with so many options available.
You’re looking for a program that’s comprehensive, engaging, and taught by experts, but also fits your learning style and goals.
Don’t worry, we’ve got you covered!
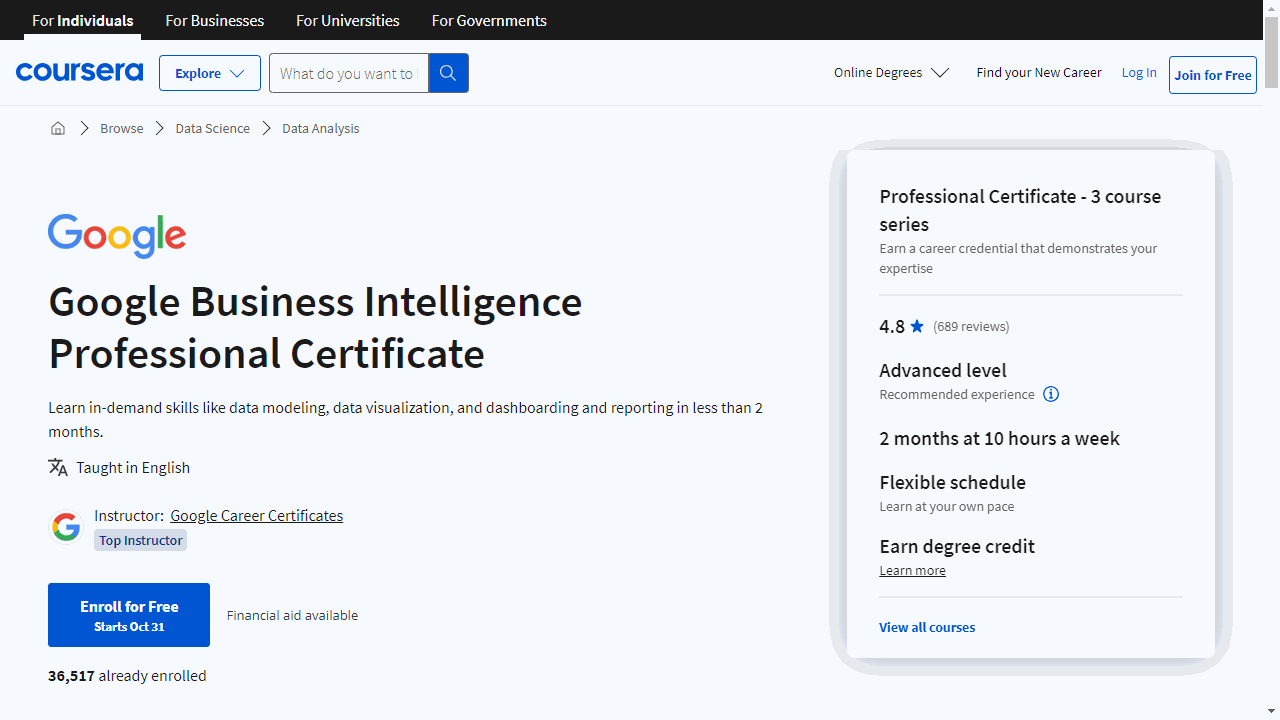
For the best business intelligence course overall on Coursera, we recommend the Google Business Intelligence Professional Certificate.
This program is a comprehensive three-course journey that equips you with the skills needed to apply for entry-level roles as a business intelligence professional.
This program is taught by Google employees who work in BI, providing real-world examples and hands-on activities.
This is a great program for those who want to enter the data field and is particularly relevant given that “data science” job descriptions today often include BI and analytics skills.
While this is our top pick, there are other great options available.
Keep reading for more recommendations for beginners, intermediate learners, and experts, as well as courses focusing on specific BI tools and techniques.
Google Business Intelligence Professional Certificate
This program is a comprehensive, three-course journey that equips you with the skills needed to apply for entry-level roles as a business intelligence (BI) professional.
I decided to add this course because not only it’s a great way to enter the data field, but also because the “data science” job descriptions today often mean business intelligence and analytics jobs.
The first course, Foundations of Business Intelligence, introduces you to the role of BI professionals and the tools they use.
You’ll learn how to make key distinctions between business intelligence and data analysis, and how to use data in business processes and decision-making.
The course is led by Google employees who work in BI, providing real-world examples and hands-on activities.
With a high rating of 4.8 from over 600 raters, it’s clear that this course delivers on its promises.
Next up is The Path to Insights: Data Models and Pipelines.
This course dives deeper into the technical aspects of BI, focusing on data modeling and extract, transform, load (ETL) processes.
You’ll learn how to determine which data models are appropriate for different business requirements, and how to design an ETL process that meets organizational and stakeholder needs.
This course also boasts a high rating of 4.7, indicating that learners find it valuable and effective.
The final course, Decisions, Decisions: Dashboards and Reports, is the cherry on top.
It allows you to apply your understanding of stakeholder needs, plan and create BI visuals, and design reporting tools, including dashboards.
You’ll learn how to produce charts that represent BI data monitored over time, and how to design BI presentations to share insights with stakeholders.
This course has the highest rating of the three, at 4.8, showing that it’s a strong finish to the program.
One of the standout features of this program is that it’s taught by Google employees who currently work in BI.
This means you’re learning from professionals who are actively involved in the field, and can provide real-world examples and insights.
The hands-on activities that simulate job tasks are another unique feature, giving you practical experience that you can apply in your future career.
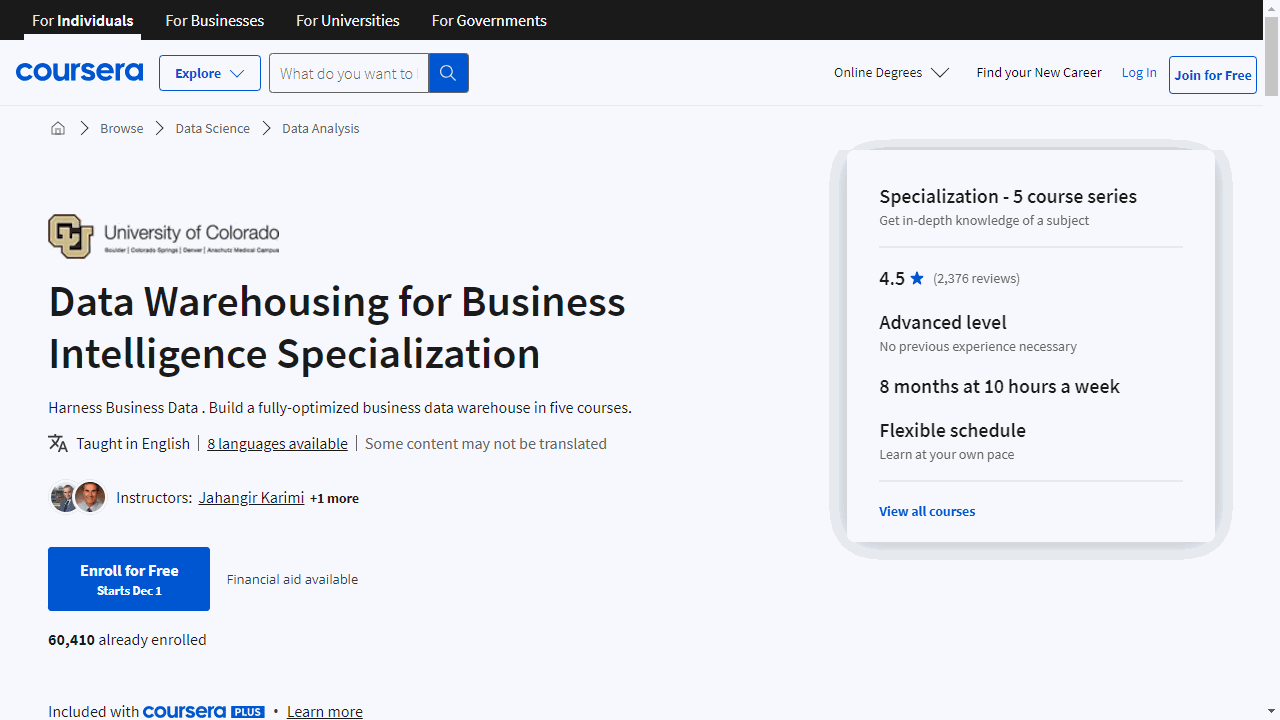
Data Warehousing for Business Intelligence Specialization
Start with “Database Management Essentials” to grasp the basics of database creation, SQL, and database design using tools like Oracle, MySQL, or PostgreSQL.
This course lays the groundwork for understanding how data is structured and accessed.
Move on to “Data Warehouse Concepts, Design, and Data Integration,” where you’ll dive into designing data warehouses and managing data flows.
You’ll work with open source software to handle data integration and pivot tables, essential for interpreting complex data.
In “Relational Database Support for Data Warehouses,” you’ll enhance your SQL skills and learn about managing summary data for business intelligence.
Topics like storage architectures and data governance are also covered, preparing you for the technical challenges in the field.
“Business Intelligence Concepts, Tools, and Applications” introduces you to data mining, visualization, and dashboard creation using MicroStrategy.
This course focuses on how to leverage data warehouses for strategic decision-making.
Finally, the capstone course, “Design and Build a Data Warehouse for Business Intelligence Implementation,” has you apply all your learning.
You’ll design a data warehouse, create integration workflows, and develop visualizations, culminating in a project that showcases your skills to potential employers.
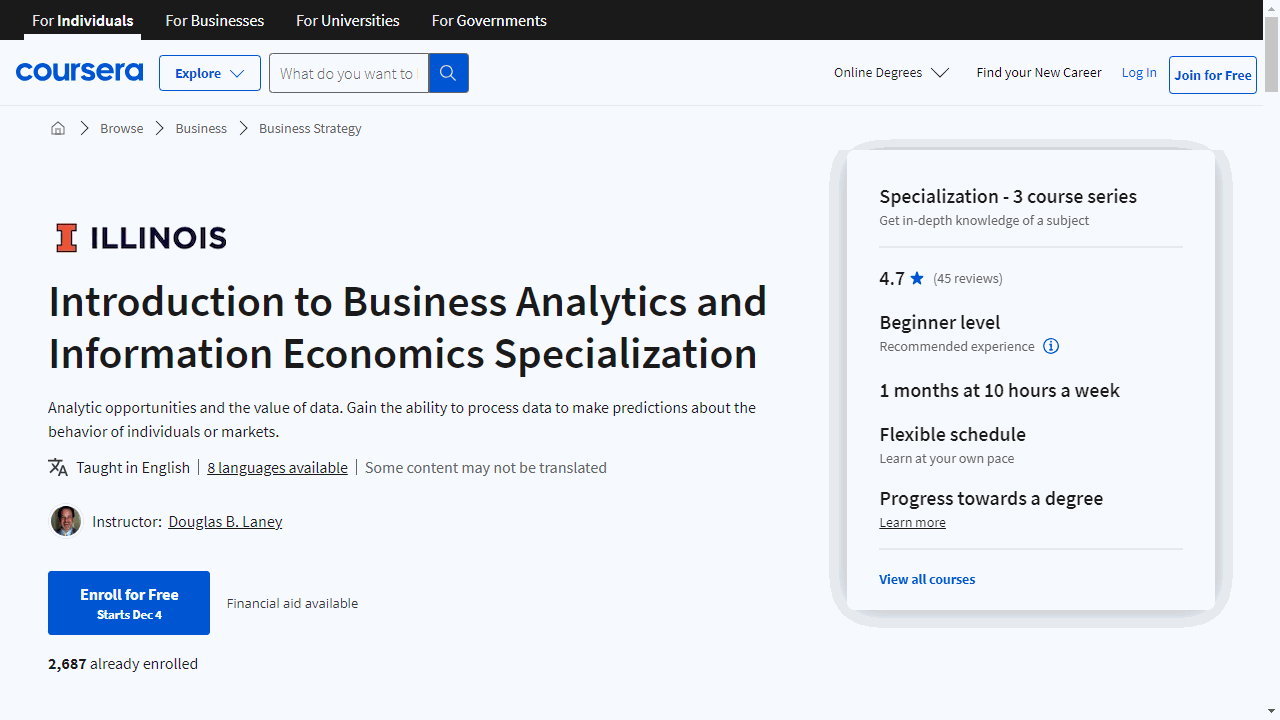
Introduction to Business Analytics and Information Economics Specialization
This specialization is a deep dive into the intersection of data, economics, and business strategy, equipping you with the tools to make data-driven decisions.
The “Business Analytics Executive Overview” course is your gateway to understanding analytics.
It’s not just about crunching numbers; it’s about interpreting data to make informed predictions and decisions.
You’ll explore a variety of real-world analytics problems and solutions, get acquainted with the latest technologies, and discuss future trends.
Moving on to “Infonomics I: Business Information Economics and Data Monetization,” this course challenges you to rethink the role of information in business.
You’ll learn to treat information as an economic asset, exploring its accounting, legal, and economic aspects.
The course guides you through innovative ways to monetize information, enhancing its value within your organization.
“Infonomics II: Business Information Management and Measurement” builds on these concepts, focusing on the management and valuation of information as an asset.
You’ll delve into asset management principles tailored to information, confront issues of ownership and control, and examine emerging organizational roles centered around information.
Throughout these courses, you’ll develop skills in accounting, big data, data analysis, and innovation.
You’ll emerge with a comprehensive understanding of how to manage and capitalize on information assets, positioning you to lead in the data-driven business landscape.
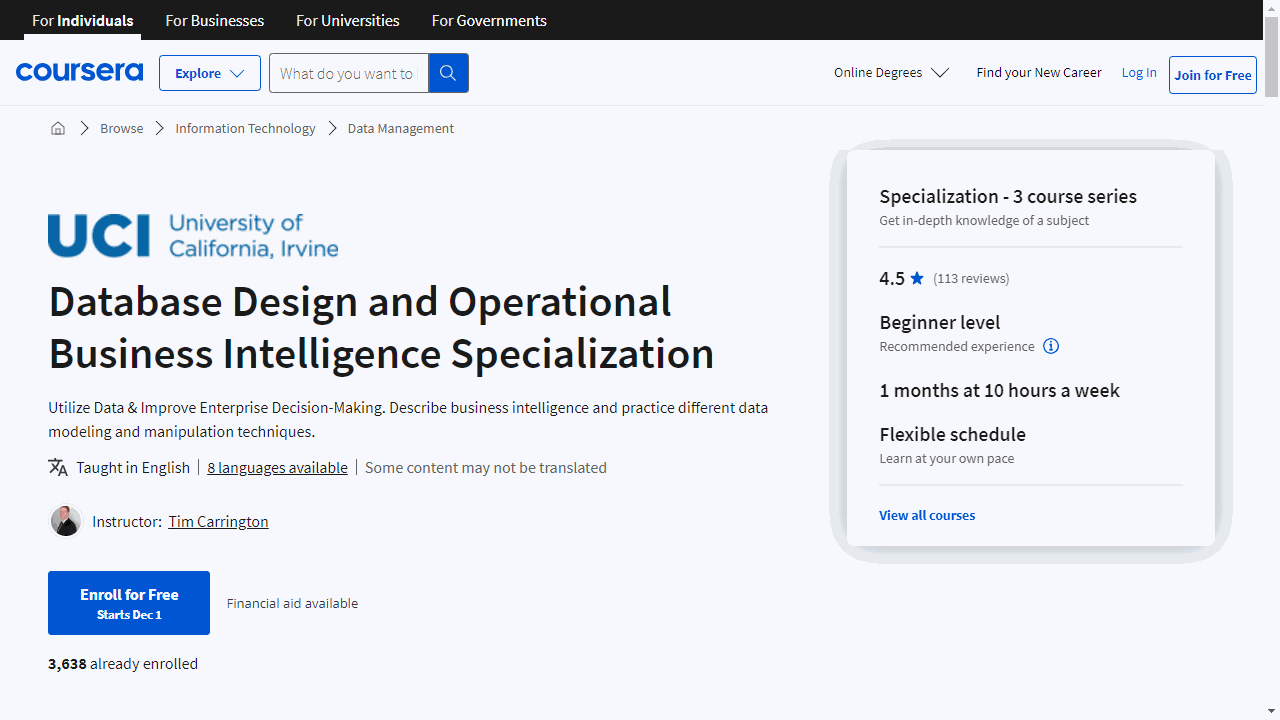
Database Design and Operational Business Intelligence Specialization
Start with “The Nature of Data and Relational Database Design” to grasp data types and database storage.
You’ll master SQL for database creation and management, essential for business intelligence roles.
The course demystifies the differences between business intelligence, analytics, and data science, and teaches you to design databases with ERDs, setting a solid foundation for your data journey.
Move on to “Data Warehousing and Business Intelligence” to deepen your understanding.
Here, you’ll learn to organize vast amounts of data in a data warehouse and apply data mining to extract actionable insights.
The course equips you with the skills to build predictive and explanatory models, empowering you to forecast trends and decode data patterns.
Lastly, “Business Intelligence and Visual Analytics” focuses on turning data into compelling visuals.
You’ll learn best practices for data visualization using SAS Viya and touch on advanced topics like cloud architecture and machine learning.
This course ensures you can present complex data in an accessible way, aiding strategic business decisions.
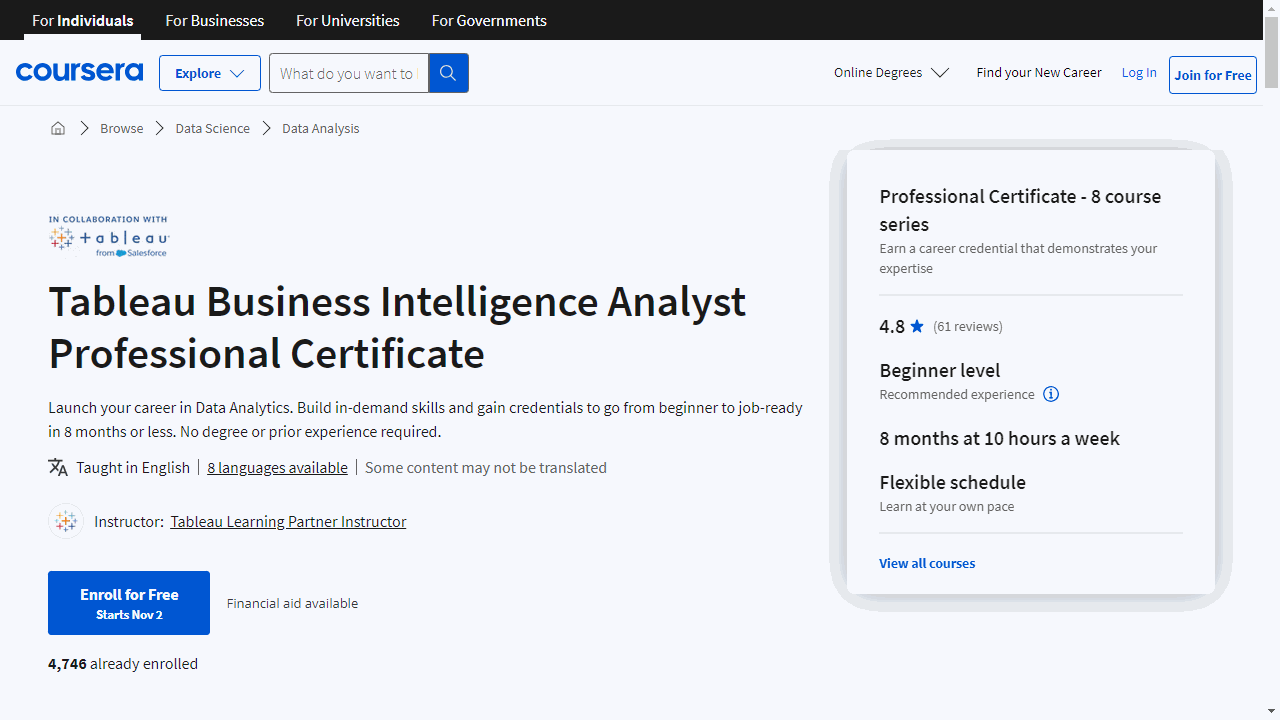
Tableau Business Intelligence Analyst Professional Certificate
This comprehensive 8-course Professional Certificate from Coursera can give you the hands-on training you need to succeed with Tableau.
These courses take you step-by-step through the key concepts, tools, and techniques used by business analysts.
You’ll start by building a strong foundation in analytics and data literacy. Then you’ll dive into the business analysis process, learning how to assess problems, gather requirements, and implement solutions.
Crucially, you’ll also gain expertise in Tableau - one of the industry-leading platforms for interactive data visualization.
Through hands-on projects, you’ll master data preparation, visualization design, dashboard creation, and data storytelling. These are pivotal skills for communicating insights and engaging stakeholders.
Other standout features include:
- Practical modules on managing data ecosystems and architecture principles
- Techniques for advanced visualizations like dual-axis charts and maps
- Data manipulation and analytics features to enhance analysis
- Design principles for crafting compelling, interactive presentations
By the end, you’ll have real-world skills to tackle business intelligence challenges.
The certificate can qualify you for entry-level analyst roles or help you stand out for promotions. Plus, you can learn at your own pace, on any device.
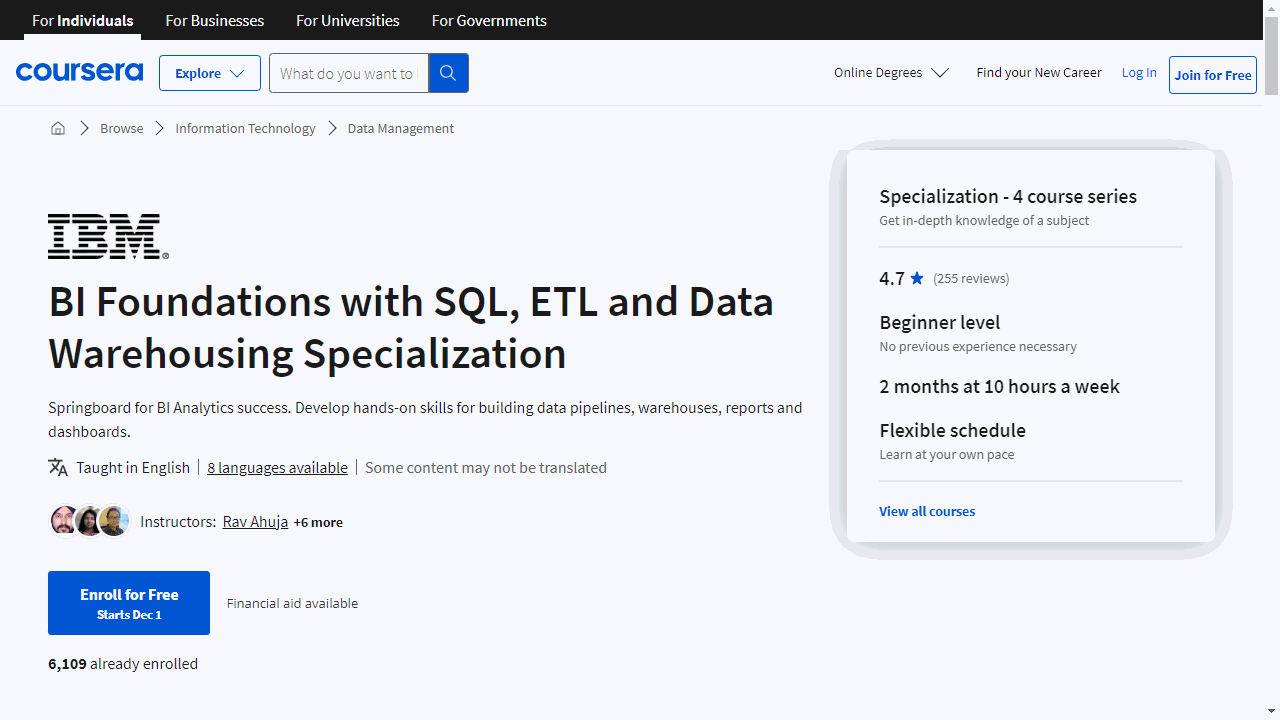
BI Foundations with SQL, ETL and Data Warehousing Specialization
This series equips you with essential BI skills through a practical, hands-on approach.
Start with “Hands-on Introduction to Linux Commands and Shell Scripting” to master Linux fundamentals and Bash scripting.
You’ll learn to navigate the Linux environment, manage files, and automate tasks with shell scripts.
The course provides a virtual Linux server for practice, culminating in a project where you’ll execute an ETL process.
Move on to “Databases and SQL for Data Science with Python,” where you’ll delve into SQL, the cornerstone language for database interaction.
From basic queries to advanced data manipulation, you’ll work with cloud databases and integrate SQL with Python in Jupyter notebooks, preparing you to analyze and manage data effectively.
In “ETL and Data Pipelines with Shell, Airflow and Kafka,” you’ll compare ETL and ELT methodologies, essential for transforming raw data into actionable insights.
Learn to build robust data pipelines using Apache Airflow and Apache Kafka, understanding the nuances of data extraction, transformation, and loading.
Lastly, “Getting Started with Data Warehousing and BI Analytics” teaches you to design and query data warehouses.
You’ll explore data warehousing architectures and use BI tools like IBM Cognos Analytics for data visualization.
Hands-on labs provide experience with MySQL, PostgreSQL, and IBM Db2, ensuring you can apply your knowledge to real-world scenarios.
Each course is designed to build your expertise in a key area of business intelligence, from Linux command mastery to sophisticated data warehousing techniques.
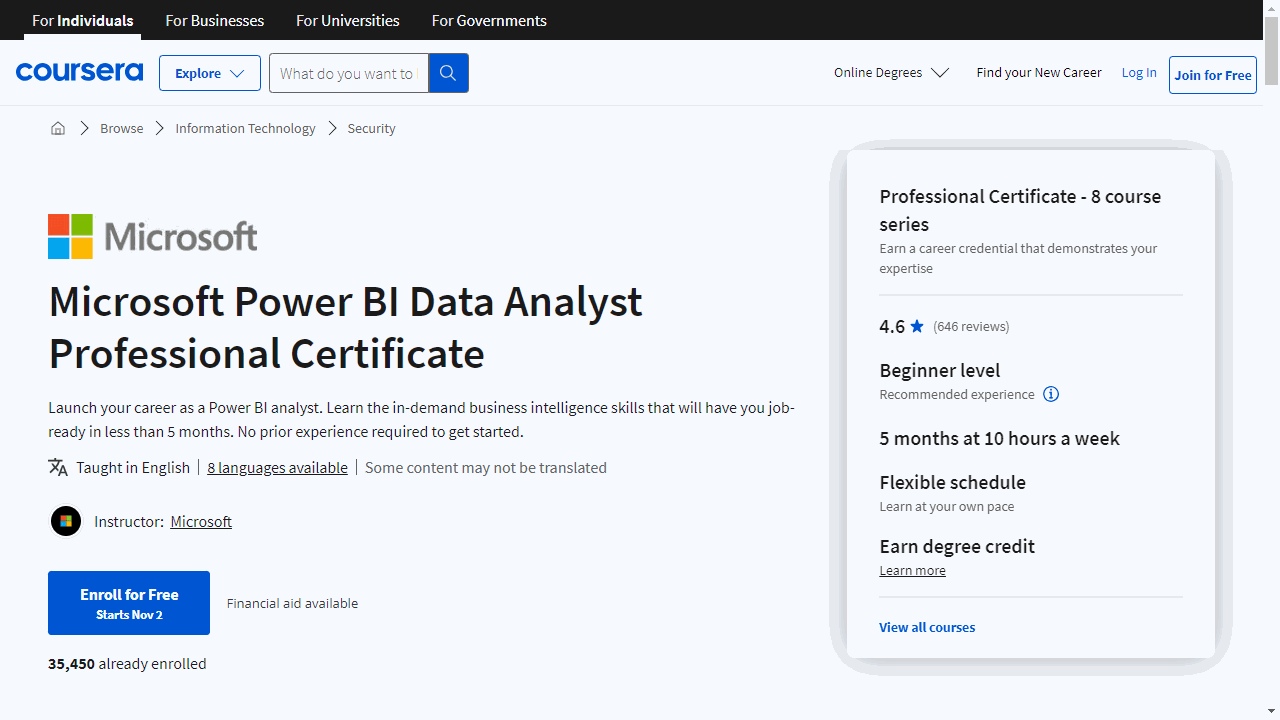
Microsoft Power BI Data Analyst Professional Certificate
The Microsoft Power BI Data Analyst Professional Certificate offered by Coursera provides the perfect blend of beginner-friendly introductions and advanced skills to equip you for data analysis jobs.
This certificate features 8 courses designed to take you from data prep novice to confident data visualizer and analyst.
The structured learning path ensures you build a strong data analytics foundation before progressing to more complex skills like dashboard creation and security implementation.
In the introductory courses, you’ll learn Excel essentials like formulas and functions to clean and organize data for analysis.
As you advance, you’ll gain expertise in Power BI for handling the full data workflow - from importing and transforming data to building interactive reports and dashboards.
Key skills covered include data modeling, DAX calculations, visualization design, and data storytelling techniques.
There’s also a course dedicated to preparing you for the PL-300 exam so you can earn official Microsoft certification.
By the end, you’ll complete a capstone project to synthesize everything you’ve learned.
This lets you showcase new data analytics abilities to make you an attractive candidate for jobs.
With a flexible online format and hands-on practice, this certificate provides real-world training for in-demand data analysis skills.
The incorporated Microsoft exam prep also ensures your skills are validated by a globally recognized certification.
If you’re ready to launch a successful career in data analytics, the Microsoft Power BI Data Analyst Professional Certificate is a smart choice.
