Data analytics is the process of examining raw data to extract meaningful insights and patterns.
It involves collecting, cleaning, and organizing data to reveal trends, make predictions, and support informed decision-making.
By learning data analytics, you can gain valuable skills that are in high demand across industries, opening doors to exciting career opportunities in fields like business intelligence, marketing, and finance.
Finding a top-notch data analytics course on Coursera can be a challenge, with so many options available.
You want a program that’s comprehensive, engaging, and taught by experts, but also fits your learning style and goals.
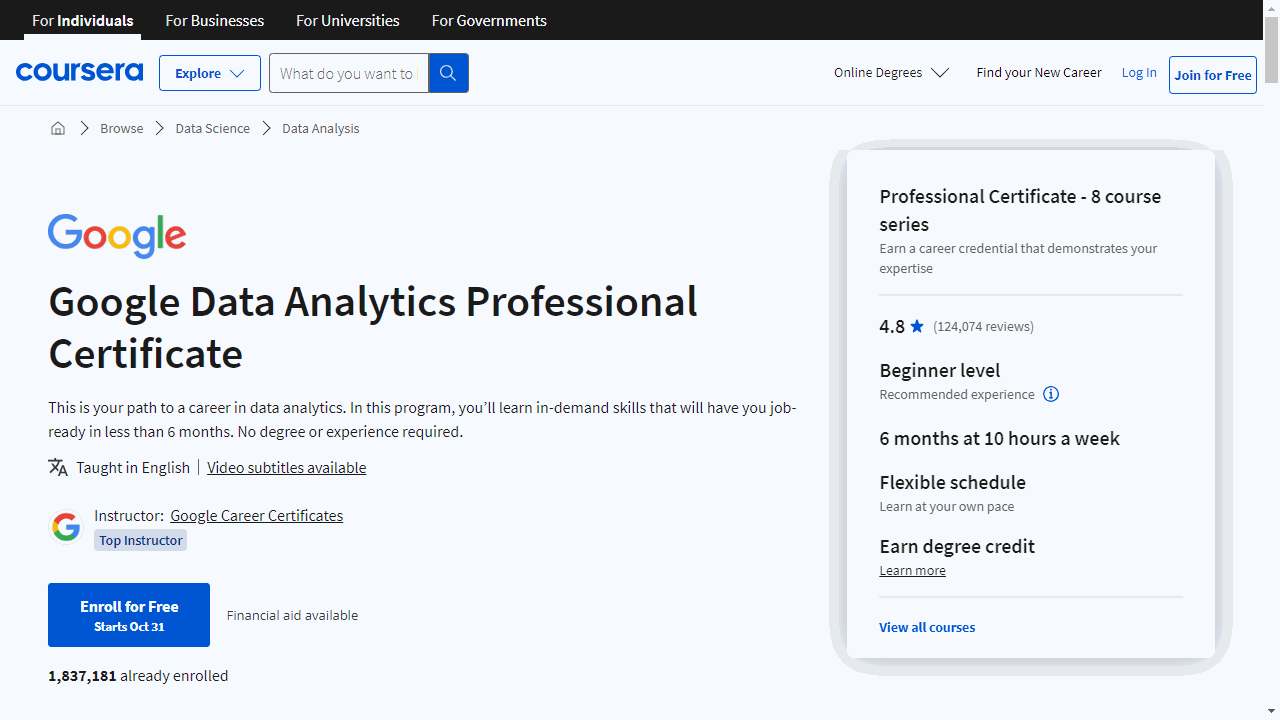
For the best data analytics course overall on Coursera, we recommend the Google Data Analytics Professional Certificate.
This program is a comprehensive and practical suite of eight courses that equip you with the skills needed to apply for entry-level data analyst jobs.
The courses are well-structured, engaging, and taught by current Google data analysts, providing a real-world perspective on the subject matter.
This is just our top pick!
There are other excellent data analytics courses on Coursera, each tailored to different learning styles and goals.
Keep reading to discover more recommendations and find the perfect course for your journey.
Quick Picks
| Course Name | Skills Acquired | Enroll Now |
|---|---|---|
| Google Data Analytics Professional Certificate | • Data cleaning and preparation • SQL for data analysis • Data visualization with Tableau • R programming basics • Case study analysis |
👉 Go to Course |
| Google Advanced Data Analytics Professional Certificate | • Python programming for data analysis • Statistical analysis and hypothesis testing • Machine learning fundamentals • Data visualization and storytelling • Advanced regression techniques |
👉 Go to Course |
| Tableau Business Intelligence Analyst Professional Certificate | • Data preparation in Tableau • Dashboard creation and design • Advanced chart types and calculations • Data storytelling techniques • Business intelligence best practices |
👉 Go to Course |
| IBM Data Analytics with Excel and R Professional Certificate | • Excel for data analysis • R programming fundamentals • Data visualization in Excel and R • Statistical analysis techniques • Dashboard creation with Cognos Analytics |
👉 Go to Course |
| Google Business Intelligence Professional Certificate | • BI fundamentals and tools • Data modeling and ETL processes • Dashboard design and creation • Data-driven decision making • Stakeholder communication |
👉 Go to Course |
| Excel Skills for Data Analytics and Visualization Specialization | • Advanced Excel functions and formulas • Data cleaning and preparation in Excel • Pivot tables and Power Pivot • Data visualization in Excel • Power Query for data transformation |
👉 Go to Course |
| Data Analysis and Visualization Foundations Specialization | • Data analysis fundamentals • Excel for data manipulation • IBM Cognos Analytics basics • Data visualization principles • Dashboard creation |
👉 Go to Course |
| IBM Data Analyst Professional Certificate | • Python for data analysis • SQL and database fundamentals • Data visualization with Python • Statistical analysis techniques • Capstone project experience |
👉 Go to Course |
| Business Analytics Specialization | • Customer analytics • Operations analytics • People analytics • Accounting analytics • Data-driven decision making |
👉 Go to Course |
| Microsoft Power BI Data Analyst Professional Certificate | • Power BI fundamentals • Data modeling in Power BI • DAX calculations • Report and dashboard creation • Data governance and security |
👉 Go to Course |
| Advanced Business Analytics Specialization | • Predictive modeling • Data mining techniques • Optimization and simulation • Data-driven decision making • Analytics communication skills |
👉 Go to Course |
| Excel Skills for Business Specialization | • Advanced Excel functions • Data analysis in Excel • Pivot tables and Power Pivot • Financial modeling • Dashboard creation in Excel |
👉 Go to Course |
Google Data Analytics Professional Certificate

If you’re searching for the best courses in data science, the Google Data Analytics Certificate on Coursera is a fantastic option.
This program is a comprehensive suite of eight courses that cover everything from the foundations of data analytics to the application of R programming.
The first course, “Foundations: Data, Data, Everywhere,” is a great starting point. It introduces you to the world of data analytics and provides an overview of the key analytical skills and tools you’ll need, such as data cleaning, data analysis, and data visualization.
The course is taught by current Google data analysts, which gives you a real-world perspective on the subject matter.
The second course, “Ask Questions to Make Data-Driven Decisions,” builds on the first course and focuses on the importance of questioning and decision-making in data analysis, which is often overlooked in similar courses.
The third course, “Prepare Data for Exploration,” introduces you to new topics that will help you gain practical data analytics skills.
You’ll learn how to use tools like spreadsheets and SQL to extract and make use of the right data for your objectives.
The fourth course, “Process Data from Dirty to Clean,” teaches you how to check and clean your data using spreadsheets and SQL.
This course stands out because it focuses on the importance of data integrity and provides you with hands-on ways to accomplish common data analyst tasks.
The fifth course, “Analyze Data to Answer Questions,” explores the “analyze” phase of the data analysis process.
You’ll learn how to organize and format your data using spreadsheets and SQL to help you look at and think about your data in different ways.
The sixth course, “Share Data Through the Art of Visualization,” shows you how data visualizations can help bring your data to life.
You’ll also explore Tableau, a data viz platform that will help you create effective visualizations for your presentations.
The seventh course, “Data Analysis with R Programming,” introduces you to the programming language known as R.
I would prefer you take a course in Python, but R is still a great language to learn for data analysis.
It’s the second most popular programming language for data analysis, after Python, and this course will teach you how to use it for data analysis.
You’ll discover how R lets you clean, organize, analyze, visualize, and report data in new and more powerful ways.
The final course, “Google Data Analytics Capstone: Complete a Case Study,” gives you the opportunity to apply what you’ve learned in a real-world context.
You’ll choose an analytics-based scenario and complete a case study, which is a great way to showcase your skills to potential employers.
Overall, the Google Data Analytics Certificate is a comprehensive and practical program that equips you with the skills needed to apply for introductory-level data analyst jobs.
The courses are well-structured, engaging, and taught by industry professionals.
Google Advanced Data Analytics Professional Certificate
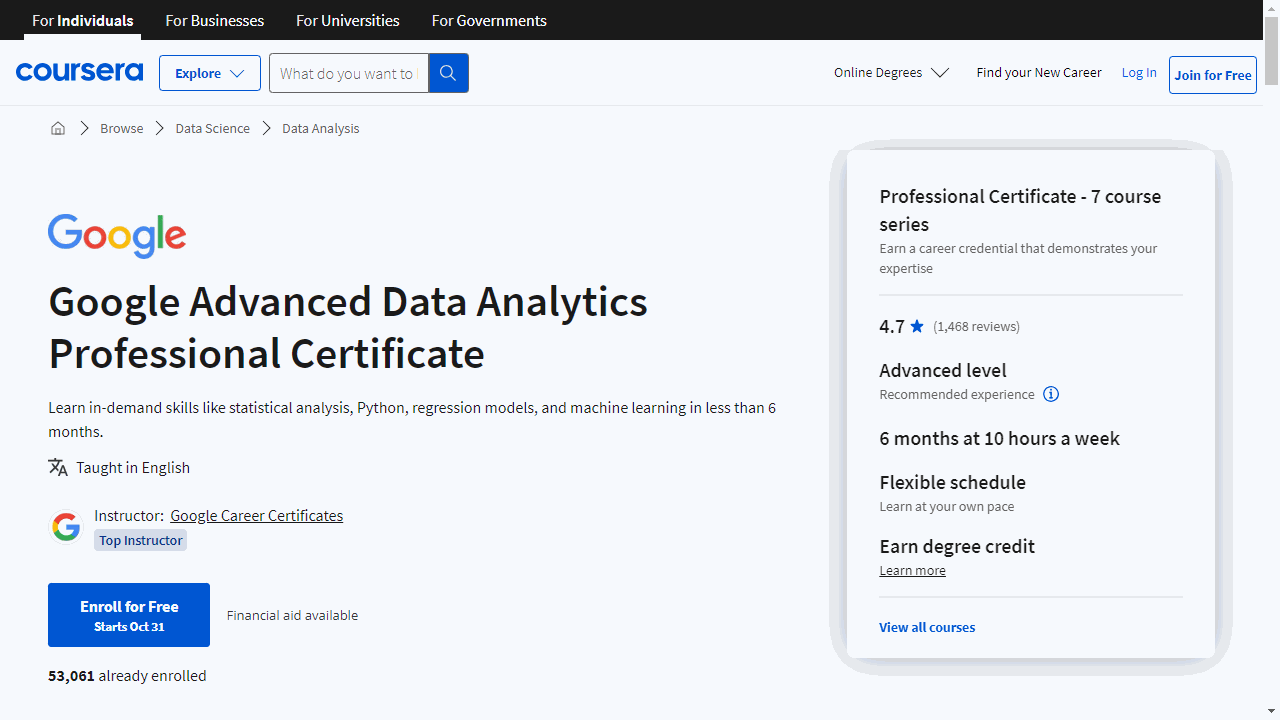
This program is a comprehensive suite of seven courses that cover everything from the foundations of data science to advanced machine learning techniques.
It’s a great option to consider after completing the previous course, as it builds on the skills and knowledge you’ve gained in that program.
The first course, Foundations of Data Science, sets the stage for your learning journey.
It introduces you to the role of data professionals and the project workflow PACE (Plan, Analyze, Construct, Execute). This course is unique because it’s taught by Google employees who work in the field, providing you with real-world examples and hands-on activities.
Next, you’ll dive into Python programming in the Get Started with Python course.
Python is a powerful tool for data analysis, and this course will teach you the basics, from variables and data types to loops and data structures.
The third course, Go Beyond the Numbers: Translate Data into Insights, teaches you how to find the story within data and communicate it effectively. You’ll practice exploratory data analysis and learn how to create compelling data visualizations.
The Power of Statistics, the fourth course, introduces you to the use of statistics in data science.
You’ll explore key concepts like probability, sampling, confidence intervals, and hypothesis testing, all while using Python for statistical analysis.
In the fifth course, Regression Analysis: Simplify Complex Data Relationships, you’ll learn about different methods of data modeling, including linear regression, analysis of variance (ANOVA), and logistic regression.
This course will help you understand how data professionals use regression analysis to discover relationships between variables and identify key factors affecting business performance.
The sixth course, The Nuts and Bolts of Machine Learning, delves into the world of machine learning.
You’ll learn about supervised and unsupervised learning, and how to apply different machine learning models to business problems.
Finally, the Google Advanced Data Analytics Capstone course gives you the opportunity to apply everything you’ve learned in a capstone project.
This is a great way to showcase your new skills and knowledge.
Tableau Business Intelligence Analyst Professional Certificate
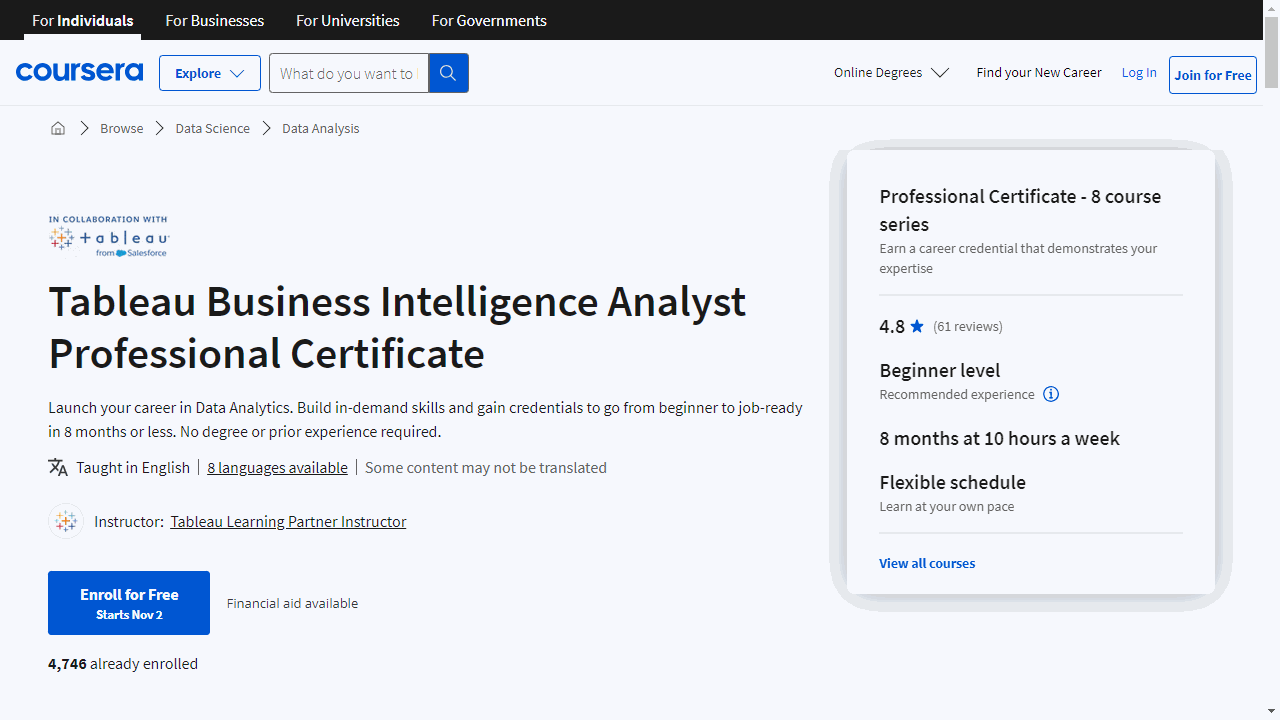
This comprehensive 8-course Professional Certificate from Coursera can give you the hands-on training you need to succeed with Tableau.
These courses take you step-by-step through the key concepts, tools, and techniques used by business analysts.
You’ll start by building a strong foundation in analytics and data literacy. Then you’ll dive into the business analysis process, learning how to assess problems, gather requirements, and implement solutions.
Crucially, you’ll also gain expertise in Tableau - one of the industry-leading platforms for interactive data visualization.
Through hands-on projects, you’ll master data preparation, visualization design, dashboard creation, and data storytelling. These are pivotal skills for communicating insights and engaging stakeholders.
Other standout features include:
- Practical modules on managing data ecosystems and architecture principles
- Techniques for advanced visualizations like dual-axis charts and maps
- Data manipulation and analytics features to enhance analysis
- Design principles for crafting compelling, interactive presentations
By the end, you’ll have real-world skills to tackle business intelligence challenges.
The certificate can qualify you for entry-level analyst roles or help you stand out for promotions. Plus, you can learn at your own pace, on any device.
IBM Data Analytics with Excel and R Professional Certificate
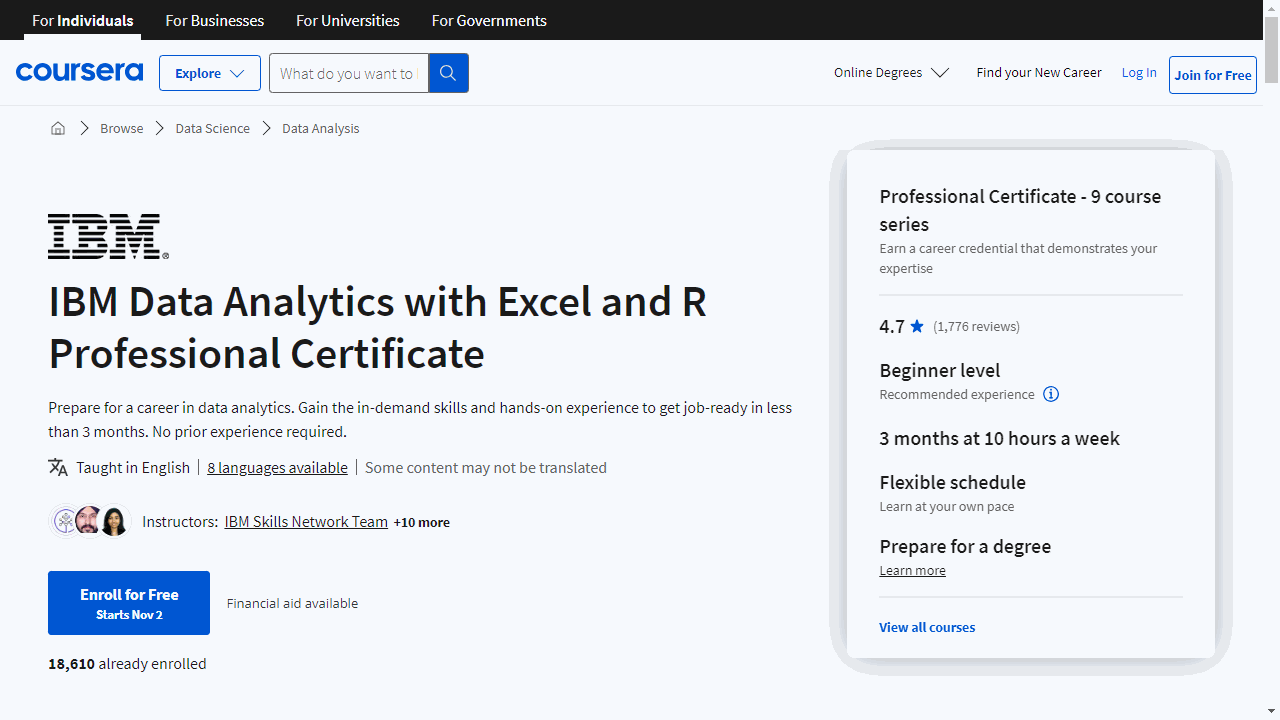
This professional certificate gives you a gentle introduction to data analysis and the key steps like gathering, cleaning, analyzing, and visualizing data.
Through a series of hands-on courses, you’ll gain in-demand skills in Excel, SQL, data visualization, dashboard creation, R programming, and more.
No coding experience required! The focus is on practical application, so you’ll complete projects and build a portfolio to showcase your abilities.
Starting from square one, you’ll get a gentle introduction to data analytics concepts.
What does a data analyst do day-to-day? How is their role different from a data scientist or engineer? This background will ensure you have the right expectations from the start.
Up next is Excel training. Excel is an essential data analytics tool that you’ll use to import, clean, analyze, and visualize data.
Easy to learn and user-friendly, Excel will become your new best friend!
With guided practice, you’ll quickly become proficient at all the most important data wrangling and analysis features.
Then comes the fun part: visualizations and dashboards!
You’ll learn to create striking charts, graphs, and maps to bring data insights to life. Using Cognos Analytics, you’ll even build interactive dashboards to impress colleagues and clients.
While Excel can take you far, real data analysts need to know R.
This powerful, open-source programming language was created for statistical analysis and is in high demand.
No worries if you’ve never coded before - you’ll learn R from square one. With hands-on practice, you’ll master the must-have skills like building data frames, functions, and pipelines.
By the end, you’ll conduct your own complete data analysis project and create a presentation to share your data-driven insights.
With IBM’s Professional Certificate on your resume, you’ll have the real-world skills to excel as a data analyst or continue your education in this fast-growing, lucrative field.
Google Business Intelligence Professional Certificate
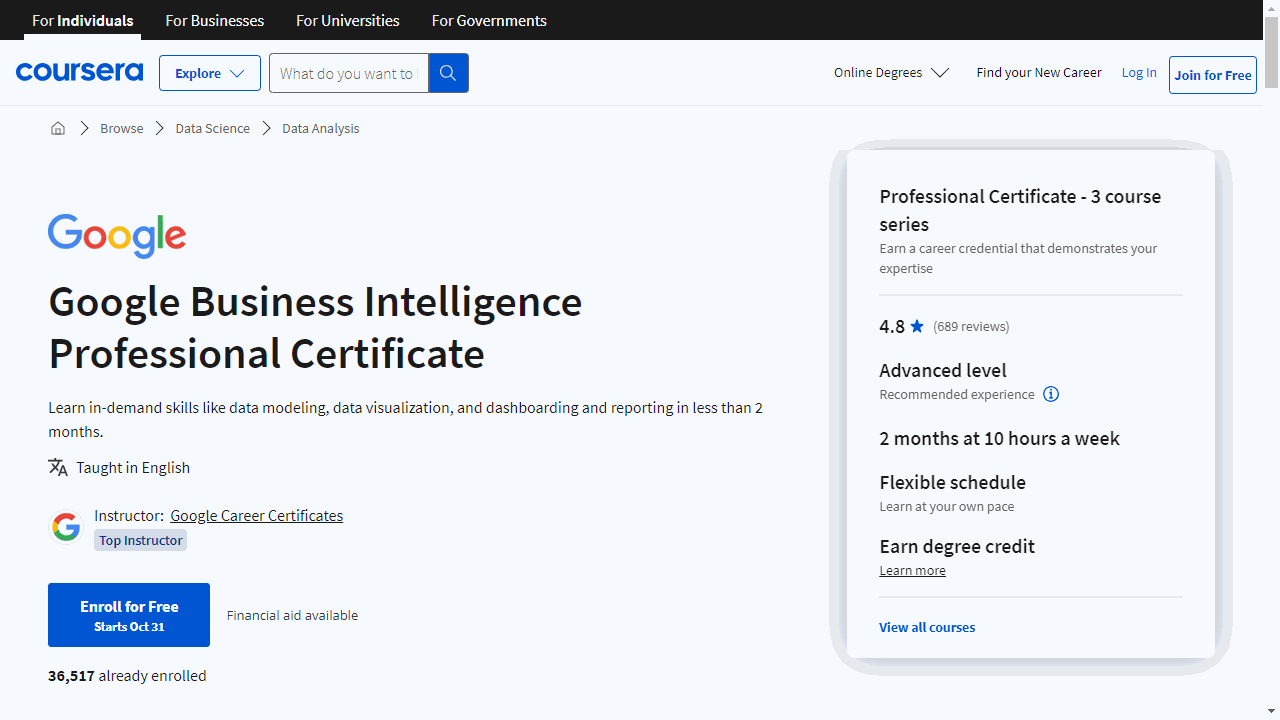
This program is a comprehensive, three-course journey that equips you with the skills needed to apply for entry-level roles as a business intelligence (BI) professional.
I decided to add this course because not only it’s a great way to enter the data field, but also because the “data science” job descriptions today often mean business intelligence and analytics jobs.
The first course, Foundations of Business Intelligence, introduces you to the role of BI professionals and the tools they use.
You’ll learn how to make key distinctions between business intelligence and data analysis, and how to use data in business processes and decision-making.
The course is led by Google employees who work in BI, providing real-world examples and hands-on activities.
With a high rating of 4.8 from over 600 raters, it’s clear that this course delivers on its promises.
Next up is The Path to Insights: Data Models and Pipelines.
This course dives deeper into the technical aspects of BI, focusing on data modeling and extract, transform, load (ETL) processes.
You’ll learn how to determine which data models are appropriate for different business requirements, and how to design an ETL process that meets organizational and stakeholder needs.
This course also boasts a high rating of 4.7, indicating that learners find it valuable and effective.
The final course, Decisions, Decisions: Dashboards and Reports, is the cherry on top.
It allows you to apply your understanding of stakeholder needs, plan and create BI visuals, and design reporting tools, including dashboards.
You’ll learn how to produce charts that represent BI data monitored over time, and how to design BI presentations to share insights with stakeholders.
This course has the highest rating of the three, at 4.8, showing that it’s a strong finish to the program.
One of the standout features of this program is that it’s taught by Google employees who currently work in BI.
This means you’re learning from professionals who are actively involved in the field, and can provide real-world examples and insights.
The hands-on activities that simulate job tasks are another unique feature, giving you practical experience that you can apply in your future career.
Excel Skills for Data Analytics and Visualization Specialization
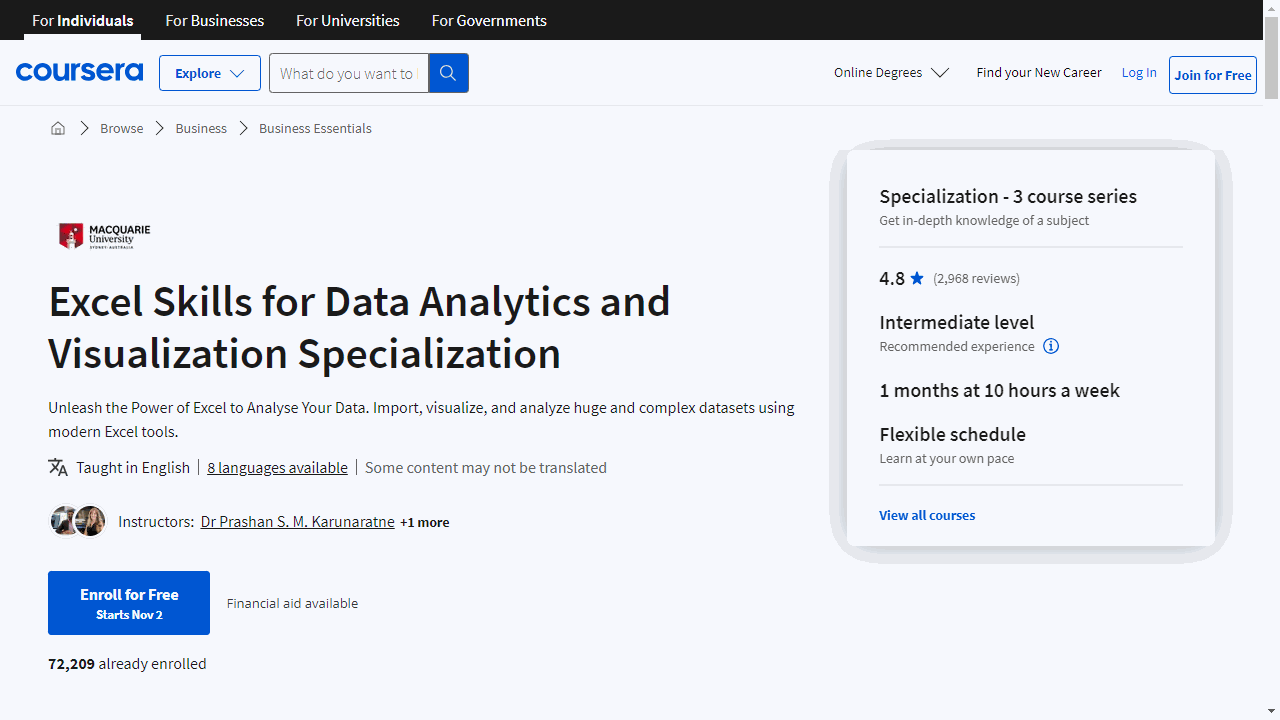
This hands-on Specialization provides you with the fundamental Excel skills you need to analyze and visualize data effectively.
The first course, Excel Fundamentals for Data Analysis, teaches you Excel essentials like data cleansing tools and functions to prepare your data for analysis.
You’ll automate repetitive tasks through Named Ranges and Tables, transforming and linking data using logical and lookup functions.
These fundamentals will boost your efficiency and build a strong data analytics foundation.
To turn your cleaned data into impactful insights, the Data Visualization in Excel course shows you how to leverage Excel’s visualization tools.
You’ll move beyond basic charts to create visualizations like sparklines, conditional formatting, and even animated charts to find the right story for your data.
Specialized charts, pivot tables, and interactive dashboards take your analysis to the next level.
The third course, Excel Power Tools for Data Analysis, introduces you to Power Query for automating data imports and preparation.
Analyze large datasets with Power Pivot, using a modeling language called DAX right inside Excel.
Finally, you’ll be introduced to Power BI to build stunning interactive reports and dashboards to share your data narrative with others.
The courses build on each other, so you get a comprehensive understanding of the data analysis process from data prep to visualization and communication.
If you want to maximize your data insights using Excel, this Specialization will empower you with the tools and techniques you need.
Data Analysis and Visualization Foundations Specialization
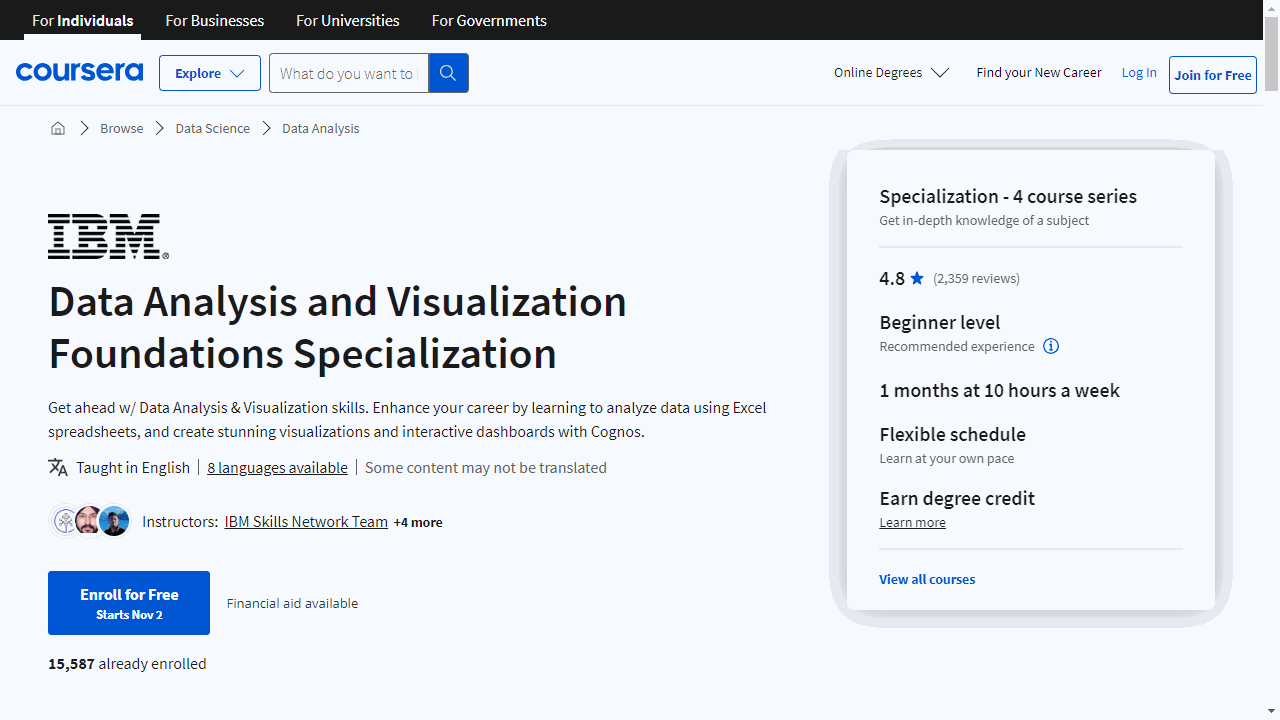
In this specialization, you’ll start with a gentle overview of data analysis and the data ecosystem, learning the difference between roles like Data Analyst, Data Scientist, and Data Engineer.
The first course covers the basics, walking you through key steps like gathering, cleaning, analyzing, and visualizing data.
You’ll also get exposure to essential big data tools like Hadoop and Spark. By the end, you’ll have completed a real-world data analysis scenario to practice your new skills.
From there, the Excel course provides hands-on data wrangling experience - no coding required.
You’ll gain proficiency in Excel by importing, formatting, and manipulating data. Key features like filtering, sorting, and pivot tables will transform scattered data into organized, readable information.
The final course brings together Excel and IBM Cognos Analytics to build interactive dashboards.
You’ll create simple charts like line and bar graphs before moving on to advanced visualizations like Treemaps and Sparklines. An Excel dashboard project lets you showcase these in-demand skills.
With a mix of video lessons and hands-on practice, this Specialization will give you a solid base in Excel, Cognos, and fundamental analysis skills to start a data analytics career.
The courses are aimed at beginners with no prior experience needed. By the end, you’ll have marketable abilities and a portfolio to show employers.
IBM Data Analyst Professional Certificate
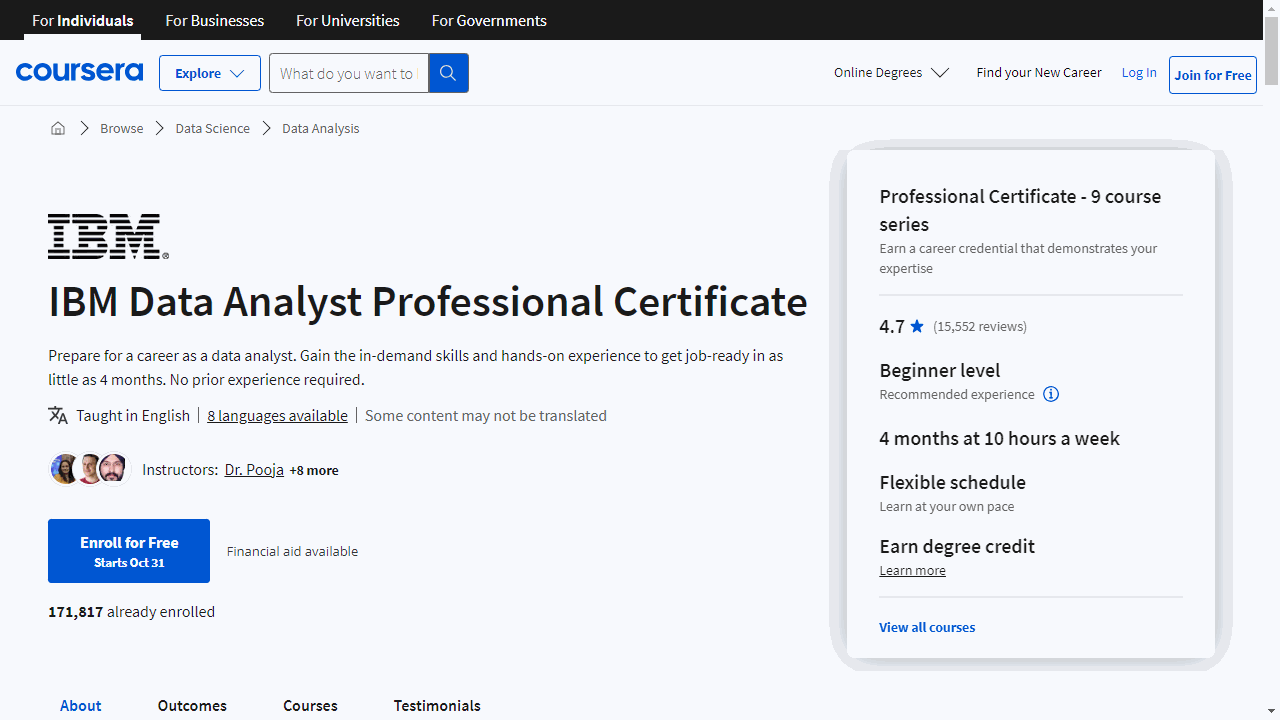
This comprehensive program offers a series of courses that cover everything from the basics of data analysis to advanced techniques and tools.
The first course, Introduction to Data Analytics, provides a solid foundation in the field, explaining the roles of data analysts, data scientists, and data engineers.
You’ll learn about the data ecosystem, including databases, data warehouses, and big data platforms.
By the end of the course, you’ll understand the fundamentals of the data analysis process, including gathering, cleaning, analyzing, and sharing data.
Next, the Excel Basics for Data Analysis course will give you a basic working knowledge of Excel and how to use it for analyzing data.
You’ll learn how to perform basic data wrangling and cleansing tasks using functions, and expand your knowledge of data analysis through the use of filtering, sorting, and pivot tables.
The Data Visualization and Dashboards with Excel and Cognos course will teach you how to create compelling data visualizations and dashboards.
You’ll learn how to use business intelligence (BI) tools like Cognos Analytics to create interactive dashboards.
This course is a great way to learn how to communicate your data analysis findings effectively.
The Python for Data Science, AI & Development course is a comprehensive introduction to Python, the most popular languages in the data science world.
You’ll learn about Python basics, data structures, and how to use Python libraries such as Pandas, Numpy & Beautiful Soup.
The Python Project for Data Science course is a mini-course designed to help you demonstrate your Python skills.
You’ll work on a real-world data set and scenario, performing tasks such as extracting data, web scraping, visualizing data, and creating a dashboard.
The Databases and SQL for Data Science with Python course is a must for any data professional.
You’ll learn SQL from the ground up, from basic SELECT statements to advanced concepts like JOINs.
The Data Analysis with Python course will take you from the basics of data analysis with Python to building and evaluating data models.
You’ll learn how to import data from multiple sources, clean and wrangle data, perform exploratory data analysis (EDA), and create meaningful data visualizations.
The Data Visualization with Python course will teach you many ways to effectively visualize both small and large-scale data.
You’ll learn to create various types of basic and advanced graphs and charts, and create interactive dashboards.
Finally, the IBM Data Analyst Capstone Project will allow you to apply everything you’ve learned in a real-world context.
You’ll perform various tasks that professional data analysts do as part of their jobs, including data collection, data wrangling, exploratory data analysis, statistical analysis, data visualization, and interactive dashboard creation.
Business Analytics Specialization
This comprehensive 5-course specialization from Coursera is designed to equip you with the latest data analytics tools and techniques used at top companies like Yahoo, Google, and Facebook.
The courses walk you through the key aspects of business analytics step-by-step.
You’ll start by learning how to leverage customer data to drive profits, discover how to predict customer behavior using simulations, decision trees, and mathematical optimization.
Next, you’ll dive into operations analytics to transform data into better business decisions.
Master forecasting demand, predicting outcomes, and quantifying risk with hands-on projects. The instructors use real-world examples to demonstrate how analytics informs strategy at successful firms.
Understanding people is critical too. The people analytics course shows you how data analysis can improve hiring, promotion, collaboration and more.
You will uncover state-of-the-art techniques used by innovative companies to recruit and retain top talent.
In addition, you’ll explore how financial statements connect to performance. Learn how accounting data provides valuable insights into consumer behavior, corporate strategy, risk management and beyond.
Finally, tie everything together in a capstone project for a global tech firm. Devise a plan to optimize data and identify key financial indicators. You’ll be ready to make smart, data-driven decisions for any business.
With highly-rated professors from Wharton, this Coursera specialization offers access to leading-edge business analytics education.
Microsoft Power BI Data Analyst Professional Certificate

The Microsoft Power BI Data Analyst Professional Certificate offered by Coursera provides the perfect blend of beginner-friendly introductions and advanced skills to equip you for data analysis jobs.
This certificate features 8 courses designed to take you from data prep novice to confident data visualizer and analyst.
The structured learning path ensures you build a strong data analytics foundation before progressing to more complex skills like dashboard creation and security implementation.
In the introductory courses, you’ll learn Excel essentials like formulas and functions to clean and organize data for analysis.
As you advance, you’ll gain expertise in Power BI for handling the full data workflow - from importing and transforming data to building interactive reports and dashboards.
Key skills covered include data modeling, DAX calculations, visualization design, and data storytelling techniques.
There’s also a course dedicated to preparing you for the PL-300 exam so you can earn official Microsoft certification.
By the end, you’ll complete a capstone project to synthesize everything you’ve learned.
This lets you showcase new data analytics abilities to make you an attractive candidate for jobs.
With a flexible online format and hands-on practice, this certificate provides real-world training for in-demand data analysis skills.
The incorporated Microsoft exam prep also ensures your skills are validated by a globally recognized certification.
If you’re ready to launch a successful career in data analytics, the Microsoft Power BI Data Analyst Professional Certificate is a smart choice.
Advanced Business Analytics Specialization
Through six courses, you’ll gain in-demand abilities to transform data into insights for smarter decision making.
The intro course gives you a strong data analytics foundation.
You’ll learn the information lifecycle, from real world to business actions. SQL skills let you extract the data you need. Relational databases will become second nature.
The predictive modeling course boosts analytical power.
Exploratory data analysis uncovers insights so you can prep data for modeling. Visualizations communicate results compellingly. XLMiner brings techniques like simulation and optimization to life.
The business analytics course focuses on decision making.
Cluster analysis segments markets. Monte Carlo simulation models uncertainty. Optimization identifies the best options among many.
No coding or advanced math needed - just Excel and the Analytic Solver Platform.
Effective communication of analytics is crucial. The dedicated course shows you how.
Tailor messaging and visuals to the audience. Stories provide context and interpretation. Convey insights clearly to non-technical stakeholders.
The capstone project ties everything together. You’ll work through a case on investing client funds.
Clean the data, build models, cluster, simulate, optimize. Finally, present actionable recommendations to clients.
Excel Skills for Business Specialization
This 4-course program will transform you into an Excel power user and give you the tools to analyze data like a pro.
The courses start with Excel basics in Essentials, taking you from spreadsheet newbie to expert in 6 weeks.
You’ll gain essential Excel skills like formatting, formulas, charts - everything you need to navigate Excel confidently.
Then Intermediate I and II build on those foundations with more advanced techniques.
We’re talking pivot tables, automation, conditional logic, forecast modeling - serious analyst stuff. These courses equip you to handle large, complex data projects.
The specialization wraps up with Advanced Excel, where you’ll learn dashboard creation, financial functions, and data cleansing.
With a teaching team guiding you every step and real-world examples to practice, you’ll gain job-ready Excel abilities.
This specialization is the fast track to becoming a data analytics whiz with the #1 analytics tool used by businesses worldwide.
Frequently Asked Questions
What Is Data Analytics And Why Is It Important?
Data analytics is the process of collecting, cleaning, transforming, and analyzing data to discover useful information, patterns, trends, and insights that can help organizations make more informed and data-driven decisions.
It involves using various statistical, mathematical, and computational techniques to extract meaningful knowledge from structured and unstructured data.
Data analytics is crucial in today’s data-driven world because it allows businesses to gain a competitive edge by better understanding their customers, operations, markets, and trends.
It enables organizations to optimize processes, reduce costs, identify new opportunities, mitigate risks, and drive innovation and growth.
Effective data analysis can lead to improved decision-making, increased efficiency, enhanced customer experiences, and better strategic planning.
What Are The Different Types Of Data Analytics?
The main types of data analytics are:
-
Descriptive analytics: This focuses on summarizing and describing what has happened in the past, often using data visualization tools to present historical data in a meaningful way.
-
Diagnostic analytics: This involves examining past data to understand the root causes and factors that led to specific outcomes or patterns. It helps organizations identify why certain events or trends occurred.
-
Predictive analytics: This type of analytics uses statistical models, machine learning, and other techniques to analyze current and historical data to make predictions about future outcomes, trends, or behaviors.
-
Prescriptive analytics: Building on predictive analytics, prescriptive analytics suggests optimal courses of action or decisions to take based on the predictions and insights gained from the data analysis.
What Skills Do You Need To Be A Good Data Analyst?
Effective data analysts typically possess a combination of technical and non-technical skills:
Technical skills:
- Statistical knowledge: Understanding statistical concepts like probability, distributions, hypothesis testing, and regression analysis.
- Programming skills: Proficiency in programming languages like Python, R, SQL, or SAS for data manipulation, analysis, and automation.
- Data visualization: Ability to create clear and visually appealing dashboards, reports, and presentations to communicate findings effectively.
- Database management: Knowledge of database structures, querying languages (SQL), and data warehousing concepts.
- Machine learning (for advanced roles): Understanding of machine learning algorithms and their applications in predictive modeling.
Non-technical skills:
- Critical thinking and problem-solving: Ability to break down complex problems, think logically, and find solutions.
- Communication: Strong written and verbal communication skills to explain technical concepts to non-technical stakeholders.
- Attention to detail: Meticulousness in handling and analyzing data to ensure accuracy and quality.
- Domain knowledge: Understanding of the specific industry or business domain to provide meaningful insights and recommendations.
- Curiosity and continuous learning: Willingness to stay updated with new data analytics tools, techniques, and industry trends.
What Common Tools Should Data Analytics Beginners Learn?
For beginners in data analytics, it’s recommended to start with the following tools:
- Microsoft Excel: Learn advanced Excel functions, data manipulation techniques, pivot tables, and data visualization features like charts and dashboards.
- SQL (Structured Query Language): Master SQL for querying and manipulating data stored in relational databases.
- Python or R: These programming languages are widely used for data cleaning, transformation, analysis, and modeling. Python is more versatile, while R is commonly used in academia and research.
- Tableau or Power BI: Data visualization tools like Tableau and Power BI allow you to create interactive dashboards and reports, making it easier to communicate insights.
As you progress, you can explore more advanced tools like Apache Spark for big data processing, TensorFlow or PyTorch for machine learning, and cloud-based data platforms like Google BigQuery or Amazon Redshift.
What Jobs Can You Get With Data Analytics Skills?
Data analytics skills are in high demand across various industries, and there are numerous job roles you can pursue:
- Data Analyst: Responsible for collecting, cleaning, analyzing, and interpreting data to support decision-making processes.
- Business Analyst: Analyzes business data, processes, and systems to identify areas for improvement and recommend solutions.
- Marketing Analyst: Utilizes data analytics to understand customer behavior, market trends, and campaign performance to optimize marketing strategies.
- Operations Analyst: Analyzes operational data to streamline processes, improve efficiency, and reduce costs.
- Financial Analyst: Analyzes financial data, economic trends, and market conditions to support investment decisions and financial planning.
- Data Scientist: An advanced role that combines statistical, programming, and domain expertise to extract insights from complex data and build predictive models.
- Business Intelligence (BI) Analyst: Designs and develops BI solutions, dashboards, and reports to facilitate data-driven decision-making.
Additionally, data analytics skills are valuable in various domains like healthcare, retail, logistics, manufacturing, and public sector organizations.
Do You Need To Learn Programming To Become A Data Analyst?
While it’s not always a strict requirement, learning programming languages like Python, R, or SQL can significantly enhance your skills as a data analyst and open up more advanced career opportunities.
Here are a few reasons why programming is beneficial for data analysts:
- Data manipulation and cleaning: Programming languages like Python and R provide powerful libraries and tools for cleaning, transforming, and preparing messy or unstructured data for analysis.
- Automation and scalability: Writing scripts or programs allows you to automate repetitive tasks and handle large datasets more efficiently, saving time and reducing human error.
- Advanced analysis: Programming enables you to perform more complex statistical analyses, build predictive models using machine learning techniques, and leverage advanced data mining algorithms.
- Data visualization: Many data visualization tools and libraries (like Matplotlib, Seaborn, ggplot2) are integrated with programming languages, allowing you to create custom and interactive visualizations.
- Database integration: Knowledge of SQL and database querying is essential for working with structured data stored in relational databases.
While it’s possible to work as a data analyst using tools like Excel and BI software initially, learning at least one programming language like Python or R can significantly broaden your skill set, increase your productivity, and make you a more versatile and valuable data analyst in the long run.
Also check our posts on: