R is a powerful programming language widely used for statistical computing, data analysis, and data visualization.
It’s an essential tool for data scientists, statisticians, and anyone involved in data-driven decision making.
Mastering R allows you to explore complex datasets, build predictive models, create insightful visualizations, and develop custom data analysis tools.
This opens up opportunities for careers in various fields like data science, research, finance, and more.
Finding the right R programming course on Coursera can be tricky, with so many options available.
You’re looking for a program that’s comprehensive, engaging, and taught by experts, but also fits your learning style and goals.
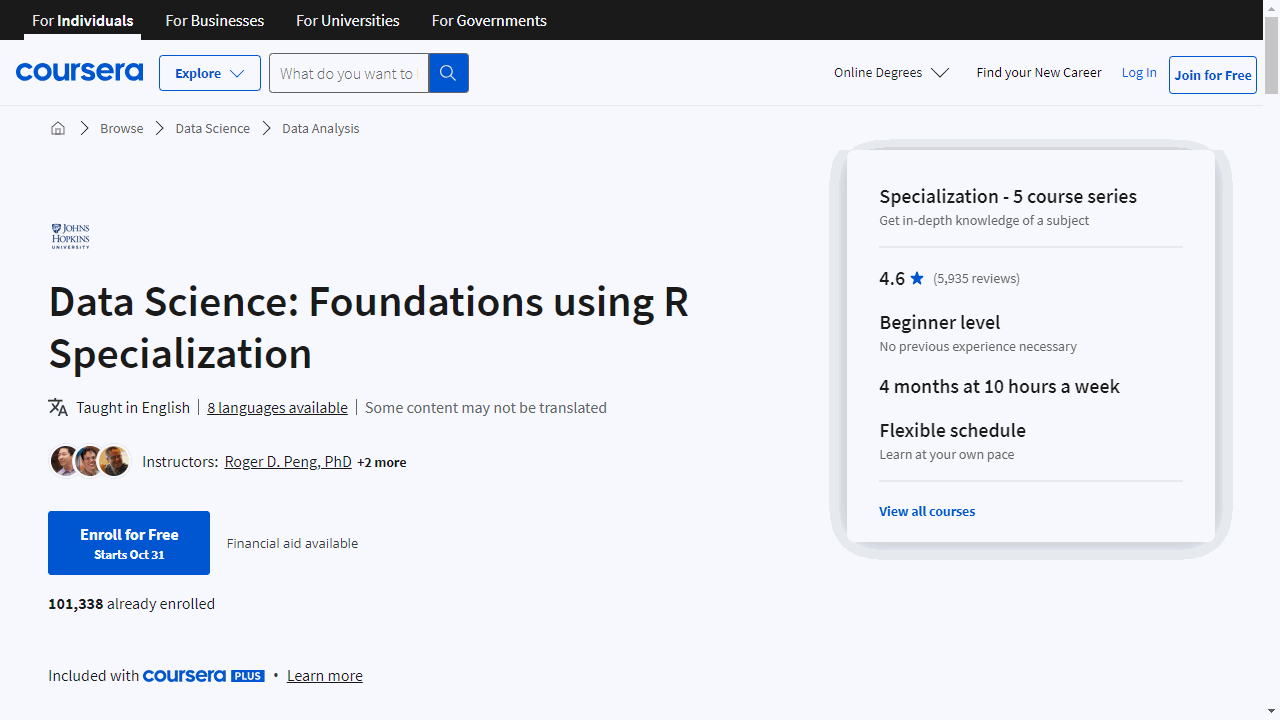
We recommend the Data Science: Foundations using R Specialization as the best overall course on Coursera.
This program, offered by Johns Hopkins University, provides a thorough introduction to R programming, covering data manipulation, statistical modeling, and visualization.
It starts with the basics, gradually introducing more advanced concepts and tools.
The hands-on projects throughout the specialization allow you to apply your knowledge and build a portfolio of practical skills.
While this is our top recommendation, we have many other excellent R programming courses on Coursera to explore.
Keep reading to discover courses tailored to different learning levels, career goals, and specific areas like data visualization and machine learning.
Data Science: Foundations using R Specialization
The first course in this specialization, offered by Johns Hopkins University, The Data Scientist’s Toolbox, introduces you to the main tools and ideas that data scientists work with.
You’ll learn how to set up R, R-Studio, Github, and other useful tools.
You’ll also gain a solid understanding of the data, problems, and tools that data analysts use.
Next up is R Programming.
This course will teach you how to program in R and how to use R for effective data analysis.
You’ll learn how to install and configure software necessary for a statistical programming environment.
The course also covers practical issues in statistical computing, including programming in R, reading data into R, accessing R packages, writing R functions, debugging, and profiling R code.
The third course, Getting and Cleaning Data, focuses on the basics of obtaining and cleaning data.
You’ll learn how to obtain data from various sources, including the web, APIs, and databases.
You’ll also learn how to make data “tidy”, which can dramatically speed up downstream data analysis tasks.
The fourth course, Exploratory Data Analysis, covers the essential techniques for summarizing data.
You’ll learn about the plotting systems in R and the basic principles of constructing data graphics.
You’ll also learn about common multivariate statistical techniques used to visualize high-dimensional data.
The final course, Reproducible Research, focuses on the concepts and tools behind reporting modern data analyses in a reproducible manner.
You’ll learn how to organize data analysis to make it more reproducible and how to write up a reproducible data analysis using knitr.
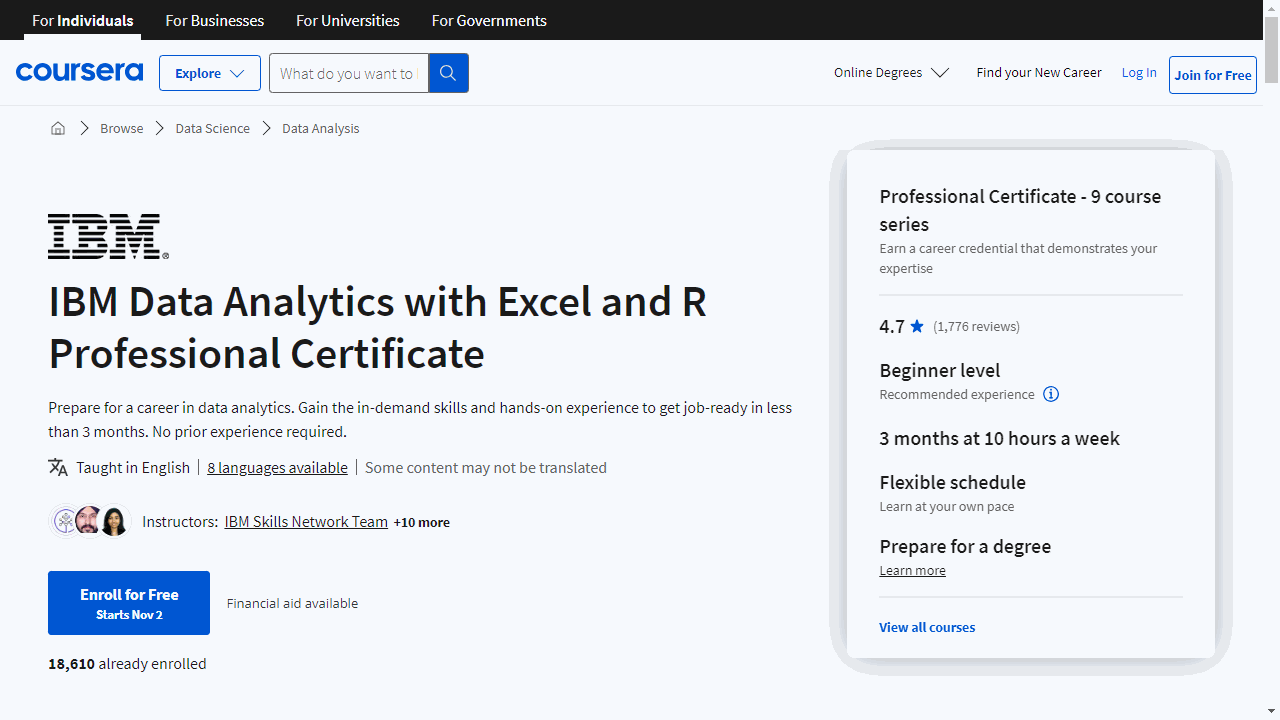
IBM Data Analytics with Excel and R Professional Certificate

This professional certificate gives you a gentle introduction to data analysis and the key steps like gathering, cleaning, analyzing, and visualizing data.
Through a series of hands-on courses, you’ll gain in-demand skills in Excel, SQL, data visualization, dashboard creation, R programming, and more.
No coding experience required! The focus is on practical application, so you’ll complete projects and build a portfolio to showcase your abilities.
Starting from square one, you’ll get a gentle introduction to data analytics concepts.
What does a data analyst do day-to-day? How is their role different from a data scientist or engineer? This background will ensure you have the right expectations from the start.
Up next is Excel training. Excel is an essential data analytics tool that you’ll use to import, clean, analyze, and visualize data.
Easy to learn and user-friendly, Excel will become your new best friend!
With guided practice, you’ll quickly become proficient at all the most important data wrangling and analysis features.
Then comes the fun part: visualizations and dashboards!
You’ll learn to create striking charts, graphs, and maps to bring data insights to life. Using Cognos Analytics, you’ll even build interactive dashboards to impress colleagues and clients.
While Excel can take you far, real data analysts need to know R.
This powerful, open-source programming language was created for statistical analysis and is in high demand.
No worries if you’ve never coded before - you’ll learn R from square one. With hands-on practice, you’ll master the must-have skills like building data frames, functions, and pipelines.
By the end, you’ll conduct your own complete data analysis project and create a presentation to share your data-driven insights.
With IBM’s Professional Certificate on your resume, you’ll have the real-world skills to excel as a data analyst or continue your education in this fast-growing, lucrative field.
Data Analysis with R Specialization
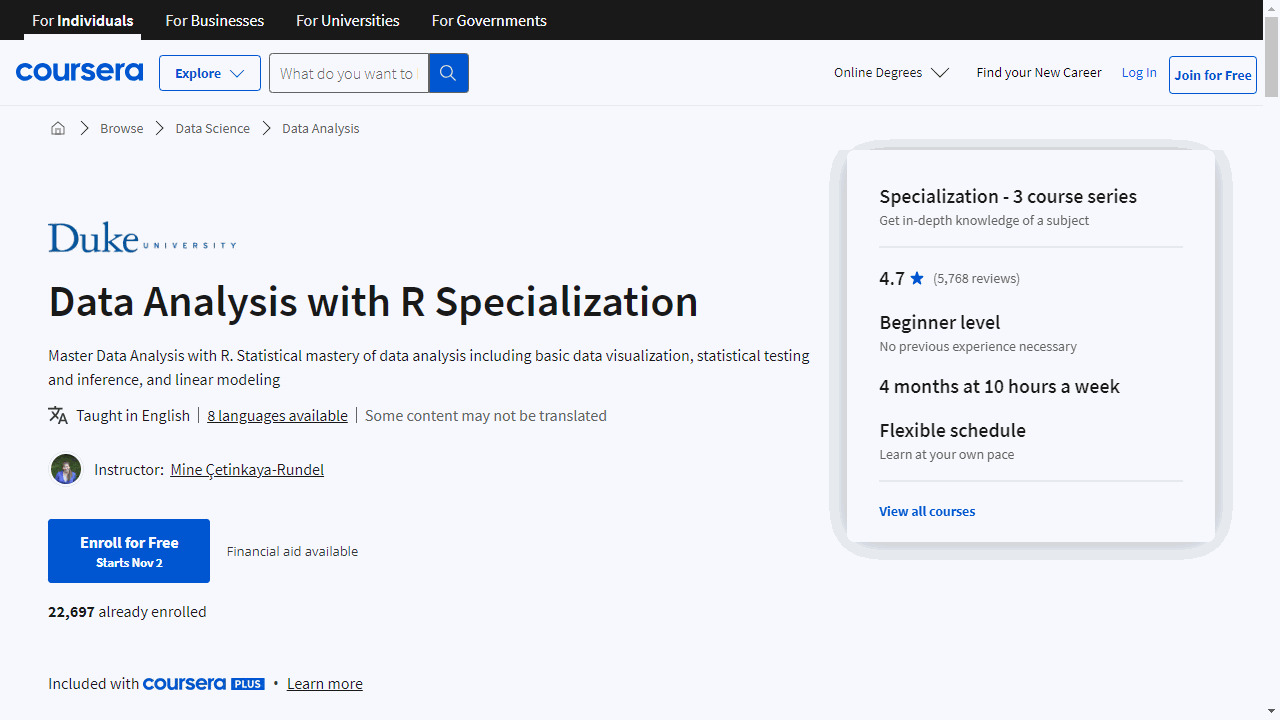
The first course in this specialization, offered by Duke University, provides a strong foundation in probability and data exploration.
You’ll learn various sampling methods and how they impact analysis.
Get hands-on practice with R and RStudio to build your skills in data visualization and summary statistics.
These are key skills that will help you interpret and understand data.
Building on that base, the second course dives into statistical inference methods.
You’ll gain practical experience running hypothesis tests, interpreting p-values, and reporting results.
Using real data examples, you’ll learn how to express the uncertainty of estimates.
More work with R will reinforce these concepts so you can apply them in the real world.
The specialization concludes with a course on linear regression modeling.
You’ll discover how to assess relationships between variables in data using simple and multiple linear regression.
Can factors like a mother’s characteristics predict her child’s test scores? You’ll find out.
More training with R will give you the tools to fit, examine, and use regression models to unlock insights.
Statistical Analysis with R for Public Health Specialization
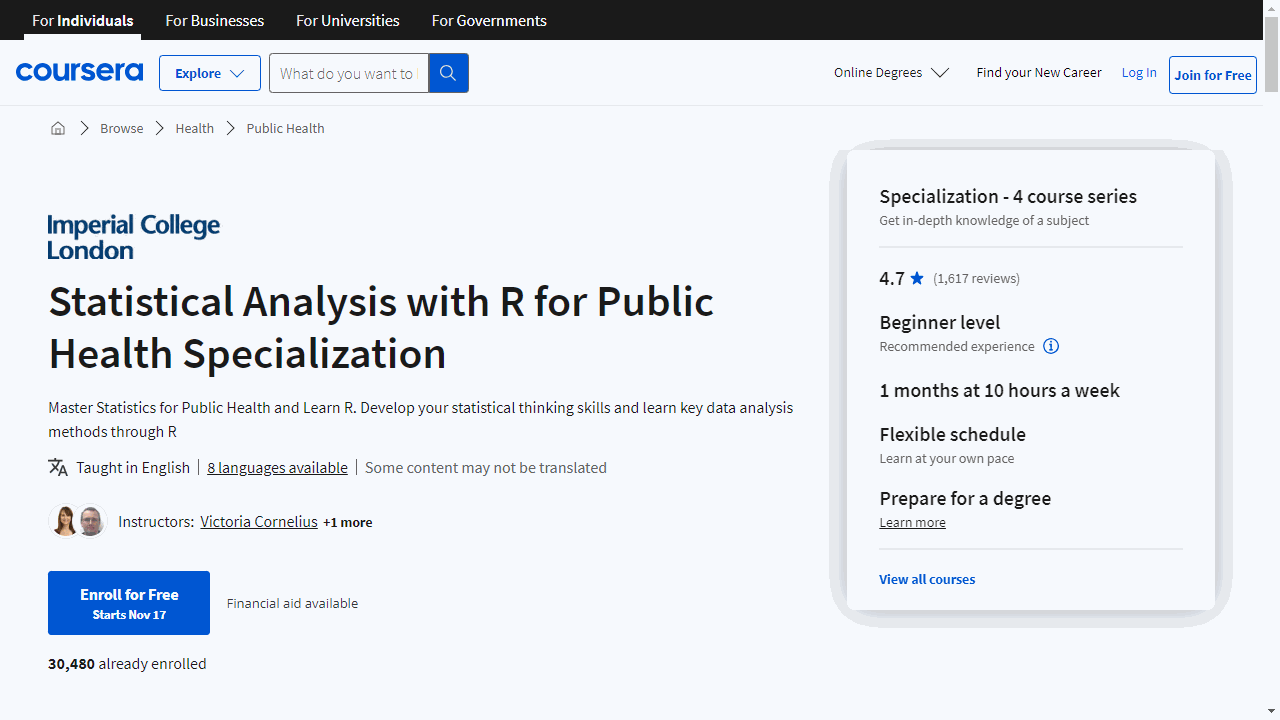
This series of courses is designed to equip you with the statistical tools and R programming prowess needed for public health analysis.
The journey begins with “Introduction to Statistics & Data Analysis in Public Health.”
This course lays the foundation, teaching you to navigate through data sets, identify key features, and conduct basic analyses.
You’ll learn to use R, a free and widely-used software, to dissect health-related data.
The course emphasizes critical thinking and practical application, ensuring you’re not just learning concepts but also applying them to real-world scenarios.
Progressing to “Linear Regression in R for Public Health,” you’ll delve into the relationship between health factors and outcomes.
The course simplifies the process of creating statistical models, starting with correlation and moving to linear regression.
You’ll learn to prepare data, assess model fit, and test assumptions, all within the R environment.
The specialization continues with “Logistic Regression in R for Public Health,” where you’ll tackle more complex analyses.
Public health data can be challenging, but this course teaches you to manage its intricacies.
You’ll learn to run logistic regression analyses, interpret the results, and understand the implications from both individual and population health perspectives.
Lastly, “Survival Analysis in R for Public Health” introduces you to time-to-event data analysis.
You’ll explore techniques like Kaplan-Meier plots and Cox regression, applying them to patient data to identify predictors of health outcomes.
This course reinforces your understanding of regression models and hones your ability to handle real-world data.
Throughout the specialization, you’ll build a robust skill set, including the ability to describe data sets, run various regression analyses, and interpret your findings.
The courses are designed for accessibility, requiring only basic numeracy and no prior knowledge of R.
Applied Data Science with R Specialization
The specialization begins with “Introduction to R Programming for Data Science.”
This course is perfect for beginners, as it requires no prior knowledge of R or programming.
You’ll start by learning the basics of R, including data types and manipulation.
The course emphasizes practical application, so you’ll be writing programs and manipulating data sets from the get-go, using popular tools like RStudio and Jupyter notebooks.
Moving on, “SQL for Data Science with R” introduces you to the essential skill of interacting with databases.
SQL is a critical tool for any data scientist, as it’s used to extract and manipulate data from relational databases.
You’ll gain hands-on experience with real databases and learn how to integrate SQL queries with R code, a skill that’s highly valued in the industry.
For those who have grasped the basics, “Data Analysis with R” offers a deeper dive into the analytical capabilities of R.
You’ll engage in data preparation, exploratory data analysis, and model development.
The course uses real-world data, such as airline performance records, to teach you how to predict outcomes and make data-driven decisions.
“Data Visualization with R” is where your data storytelling skills will come to life.
Through the use of ggplot2 and Leaflet, you’ll learn to create a variety of charts, plots, and maps that not only look professional but also effectively communicate your findings.
The course also introduces you to R Shiny for building interactive web applications, adding a dynamic edge to your data presentations.
The culmination of this specialization is the “Data Science with R - Capstone Project.”
This is where you’ll apply everything you’ve learned in a comprehensive project that simulates real-world data science tasks.
You’ll collect data, conduct analysis, and present your findings in a professional format, giving you a taste of what it’s like to work as a data scientist.
Data Visualization & Dashboarding with R Specialization
If you’re searching for a solid foundation in R programming with a focus on data visualization, the “Data Visualization & Dashboarding with R Specialization” on Coursera is a standout choice.
This series of courses is designed to equip you with the skills needed to turn data into compelling visual stories, a must-have ability in today’s data-driven world.
The journey begins with “Getting Started with Data Visualization in R.”
This course is tailored for those new to R, providing a gentle introduction to the language and its capabilities.
You’ll learn how to import data, use the tidyverse package for data manipulation, and create basic reports with R Markdown.
It’s an ideal starting point if you’re looking to get your feet wet without being overwhelmed.
As you progress to “Data Visualization in R with ggplot2,” you’ll build on your foundational knowledge.
This course zeroes in on the ggplot2 package, a versatile tool for crafting a wide array of visualizations.
You’ll learn to create and refine plots, focusing on the visual presentation of data rather than the underlying data management processes.
With “Advanced Data Visualization with R,” you’ll take your skills further.
This course introduces additional packages that enhance ggplot2, allowing you to create more sophisticated and varied visualizations, including spatial data representations and interactive elements.
It’s a deep dive into the possibilities of data visualization with R.
The fourth course, “Publishing Visualizations in R with Shiny and flexdashboard,” shifts the focus to sharing and presenting your work.
You’ll explore how to build interactive visualizations with Shiny and combine various R outputs into dashboards.
This course is about making your data not just insightful but also engaging and interactive for your audience.
The “Data Visualization Capstone” is the culmination of your learning experience.
Here, you’ll apply the skills you’ve acquired to a unique project, using real-world data to craft a narrative that’s both informative and visually appealing.
It’s your opportunity to demonstrate your ability to deliver a complete data visualization project from start to finish.
If you’re aiming to master data visualization in R, this specialization offers a structured and comprehensive path to achieving that goal.
Tidyverse Skills for Data Science in R Specialization
This series of courses presents you the Tidyverse, an integrated collection of R packages designed for data science.
Keep in mind, a basic understanding of R is recommended before you start.
If you’re not yet familiar with R, consider a preliminary course to get up to speed.
The journey begins with “Introduction to the Tidyverse,” where you’ll grasp the concept of tidy data.
This course sets the stage by teaching you how to organize data effectively, a fundamental skill for any subsequent analysis.
Moving on, “Importing Data in the Tidyverse” addresses the initial challenge of data analysis: importing data into R.
You’ll learn to navigate various data formats and sources, ensuring that you can consolidate and prepare data for exploration, no matter where it comes from.
With “Wrangling Data in the Tidyverse,” you’ll delve into the nitty-gritty of data transformation.
This course is all about refining your data, using tools like dplyr to reshape and clean it, preparing it for deeper analysis.
It’s a crucial step to ensure accuracy and clarity in your work.
“Visualizing Data in the Tidyverse” introduces you to the art of data visualization with ggplot2.
Here, you’ll learn to create informative and engaging graphics that can reveal trends and patterns in your data, a key skill for communicating your findings.
Lastly, “Modeling Data in the Tidyverse” rounds out your training by teaching you to build and interpret models.
From hypothesis testing to machine learning, you’ll discover how to extract meaningful insights from your data, supporting informed decision-making.
Data Analytics in the Public Sector with R Specialization
If you’re searching for a solid R programming course with a public sector focus, the “Data Analytics in the Public Sector with R Specialization” on Coursera is for you.
This series of courses is designed to build your skills progressively, starting with the “Fundamentals of Data Analytics in the Public Sector with R.”
Here, you’ll get a firm grasp on R programming basics and public administration concepts, learning to manipulate and analyze data with the tidyverse and dplyr package.
It’s a hands-on approach to understanding data within the context of the public sector.
Moving on, the course “Exploratory Data Analysis for the Public Sector with ggplot” teaches you to visualize data effectively.
You’ll master the art of creating informative and aesthetically pleasing visualizations using ggplot2, turning complex data sets into clear, communicative graphics.
This skill is crucial for presenting data in a way that’s both accessible and actionable.
The third course, “Assisting Public Sector Decision Makers With Policy Analysis,” takes your skills further into the realm of policy analysis.
You’ll apply your analytical prowess to real-world scenarios, evaluating the efficiency and effectiveness of policies using advanced statistical methods.
This course is particularly valuable for those looking to support decision-making processes with robust data analysis.
Lastly, “Politics and Ethics of Data Analytics in the Public Sector” provides a thoughtful examination of the ethical considerations in data analytics.
You’ll learn to navigate the complexities of data ethics and apply this knowledge in a capstone project, where you’ll perform a policy analysis using genuine data.
Each course builds on the last, ensuring a comprehensive learning experience.
All the while, you’ll work within RStudio on the Coursera platform, eliminating the need for additional software installations.
This specialization is more than just a set of R programming tutorials; it’s a pathway to becoming a competent data analyst in the public sector.
Frequently Asked Questions
What is the R programming language and why is it important?
R is an open-source programming language and software environment for statistical computing, data analysis, and data visualization.
It is widely used in various fields, including academia, research, business, and data science. R is important because it provides a powerful toolset for data manipulation, statistical modeling, and graphics creation.
It enables researchers, analysts, and data scientists to perform complex statistical analyses, create publication-quality graphics, and develop custom data analysis tools.
What are the different types of R programming?
While R is primarily a programming language for data analysis and statistics, it can also be used for various other tasks, such as:
- Statistical Modeling: R excels at implementing a wide range of statistical models, from simple linear regression to complex machine learning algorithms.
- Data Manipulation: R provides robust data manipulation capabilities through packages like dplyr and data.table, allowing efficient data cleaning, transformation, and wrangling.
- Data Visualization: R has excellent data visualization capabilities through packages like ggplot2 and plotly, enabling the creation of high-quality static and interactive graphics.
- Reproducible Research: R provides tools like R Markdown and Shiny for creating reproducible research documents and interactive web applications.
- Geospatial Analysis: With packages like sf and raster, R can handle spatial data and perform geospatial analysis tasks.
- Machine Learning: R has packages like caret, randomForest, and kernlab that enable various machine learning techniques, including supervised and unsupervised learning.
What skills do you need to be good at R programming?
To be proficient in R programming, you should develop the following skills:
- Statistical Knowledge: A solid understanding of statistical concepts and methods is essential for effective data analysis and modeling in R.
- Programming Fundamentals: Familiarity with programming concepts like control structures, functions, and data structures is necessary for writing efficient R code.
- Data Manipulation: Skills in data wrangling, cleaning, and transformation using packages like dplyr and tidyr are crucial for preparing data for analysis.
- Data Visualization: The ability to create clear and informative visualizations using packages like ggplot2 and plotly is vital for communicating insights effectively.
- Package Management: Knowing how to install, load, and manage packages from CRAN and other repositories is important for leveraging R’s extensive ecosystem.
- Reproducible Research: Understanding tools like R Markdown and Shiny can help in creating reproducible research documents and interactive applications.
- Problem-Solving: Strong problem-solving skills are needed to tackle complex data analysis challenges and develop custom solutions using R.
What common tools should R beginners learn?
As a beginner in R programming, it is recommended to learn the following tools and packages:
- RStudio: RStudio is an integrated development environment (IDE) that provides a user-friendly interface for writing, executing, and debugging R code, as well as managing packages and projects.
- dplyr: This package is part of the tidyverse collection and provides a consistent set of functions for data manipulation tasks, such as filtering, sorting, and summarizing data.
- ggplot2: This powerful data visualization package allows you to create complex and publication-quality plots with a layered grammar of graphics approach.
- tidyr: This package is part of the tidyverse and offers functions for data tidying and reshaping, which are essential tasks in data preparation.
- readr and readxl: These packages facilitate reading and importing various data formats, including CSV, Excel, and other tabular data.
- R Markdown: R Markdown is a powerful tool for creating reproducible research documents that combine code, visualizations, and narrative text.
- Git and GitHub: Learning version control with Git and hosting your projects on GitHub is highly recommended for collaboration and sharing code.
What jobs can you get with R programming skills?
R programming skills are highly valued in various industries and job roles, including:
- Data Scientist: Data scientists use R for data exploration, modeling, and deriving insights from complex datasets.
- Statistician: R is a popular choice for statisticians in academia, research, and industry for performing statistical analyses and modeling.
- Business Analyst: Analysts in business settings use R for data manipulation, visualization, and reporting to support decision-making.
- Quantitative Researcher: Researchers in fields like finance, economics, and social sciences leverage R for quantitative analysis and modeling.
- Bioinformatician: R is widely used in bioinformatics for analyzing biological data, such as gene sequences and proteomics data.
- Data Journalist: Data journalists use R to analyze and visualize data for storytelling and communicating insights effectively.
- Marketing Analyst: Marketing analysts employ R for data analysis, customer segmentation, and campaign optimization.
What should I look for in an R programming course for beginners?
When choosing an R programming course for beginners, consider the following factors:
- Comprehensive Introduction: The course should provide a thorough introduction to R, covering syntax, data structures, control flow, and basic data manipulation and visualization.
- Hands-on Practice: Practical exercises and projects are essential for reinforcing the concepts learned and building practical skills.
- Tidyverse Coverage: The tidyverse collection of packages is widely used in R, so the course should cover at least the core tidyverse packages like dplyr, ggplot2, and tidyr.
- Data Visualization: Strong emphasis should be placed on data visualization techniques and best practices using packages like ggplot2 or plotly.
- Real-world Examples: The course should include real-world examples and case studies to demonstrate the practical applications of R in various domains.
- Instructor Support: Access to instructor support or a community forum can be helpful for getting assistance and clearing doubts during the learning process.
- Project-based Learning: A capstone project or a series of guided projects can help solidify the skills learned and provide a portfolio piece.
What are the common uses of R programming across various industries?
R programming is widely used across various industries for a range of data analysis and computational tasks. Here are some common uses of R across different industries:
-
Academia and Research: R is extensively used in academia and research for statistical analysis, data exploration, modeling, and visualization in fields such as biology, psychology, social sciences, and economics.
-
Healthcare and Pharmaceuticals: R is employed for clinical trial analysis, drug development, biostatistics, and bioinformatics tasks like gene expression analysis and genomic data analysis.
-
Finance and Banking: Financial institutions use R for risk modeling, portfolio optimization, quantitative trading, and financial data analysis.
-
Marketing and Consumer Analytics: R is utilized for market research, customer segmentation, campaign optimization, and sentiment analysis in the marketing and consumer analytics domains.
-
Environmental Sciences: Researchers in environmental sciences use R for spatial data analysis, environmental modeling, and climate data analysis.
-
Business Analytics: R is applied in business analytics for data exploration, predictive modeling, forecasting, and reporting to support data-driven decision-making.
-
Quality Control and Manufacturing: R is employed for statistical process control, quality assurance, and defect analysis in manufacturing and quality control settings.
-
Social Sciences and Public Policy: R is used in social sciences and public policy research for survey analysis, demographic data analysis, and policy impact evaluation.
Also check our posts on: