Data science is a rapidly growing field that uses scientific methods, algorithms, processes, and systems to extract knowledge and insights from structured and unstructured data.
It involves collecting, cleaning, analyzing, and interpreting data to solve complex problems and uncover hidden patterns.
Learning data science opens doors to exciting careers in various industries, allowing you to contribute to cutting-edge research and make a real impact.
Finding the right data science course on Coursera can be challenging with so many options available.
You’re looking for a comprehensive, engaging, and expert-led program that fits your learning style and goals.
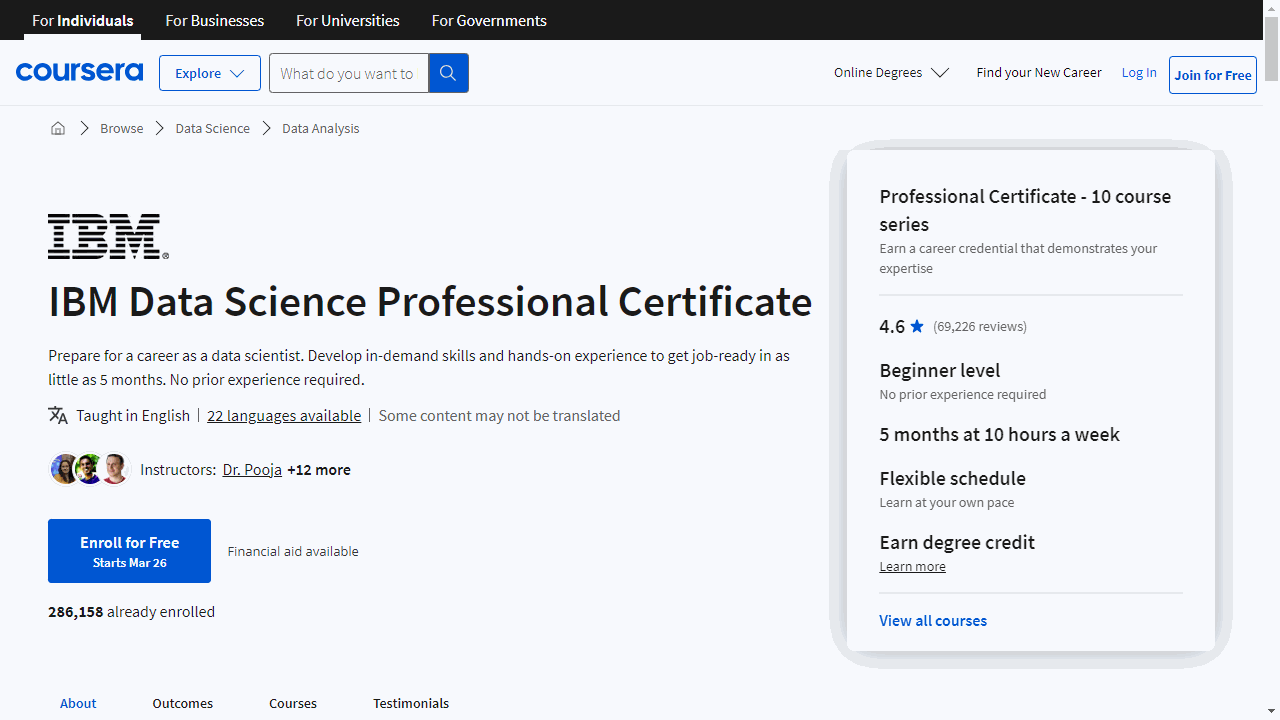
We’ve reviewed countless courses and recommend the IBM Data Science Professional Certificate as the best overall.
This program covers essential data science topics and tools, guiding you through the entire data science lifecycle, from data collection and cleaning to analysis, visualization, and deployment.
It includes hands-on projects using real-world datasets, allowing you to apply your knowledge and build a strong portfolio.
While this is our top pick, there are many other great data science courses on Coursera.
Keep reading to discover more options, tailored to specific areas of data science, learning levels, and even career goals.
Quick Picks
| Course | Skills |
|---|---|
| IBM Data Science Professional Certificate | • Data analysis skills • Python for data science • Machine learning techniques |
| Introduction to Data Science Specialization | • Data science overview • Tools for data science • Data science methodologies |
| Data Science Fundamentals with Python and SQL Specialization | • Python programming • SQL querying • Data analysis |
| Data Science Specialization | • Data analysis • R programming • Machine learning |
| Applied Data Science Specialization | • Python Programming • Data Analysis • Visualization |
| Data Science: Foundations using R Specialization | • R programming skills • Data manipulation • Reproducible research |
| Applied Data Science with Python Specialization | • Python data science • Machine learning • Data visualization |
| Learn SQL Basics for Data Science Specialization | • Write SQL queries • Manipulate data • Analyze data |
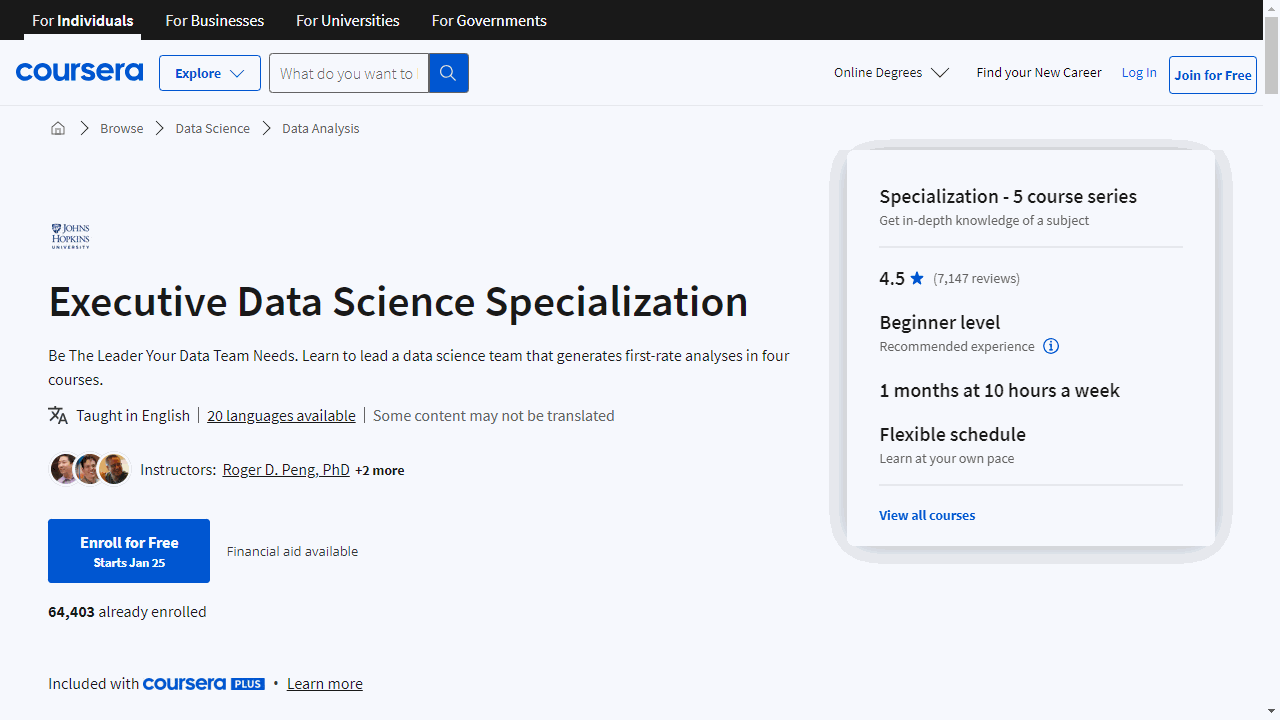
| Executive Data Science Specialization | • Lead data teams • Manage analysis • Apply data science |
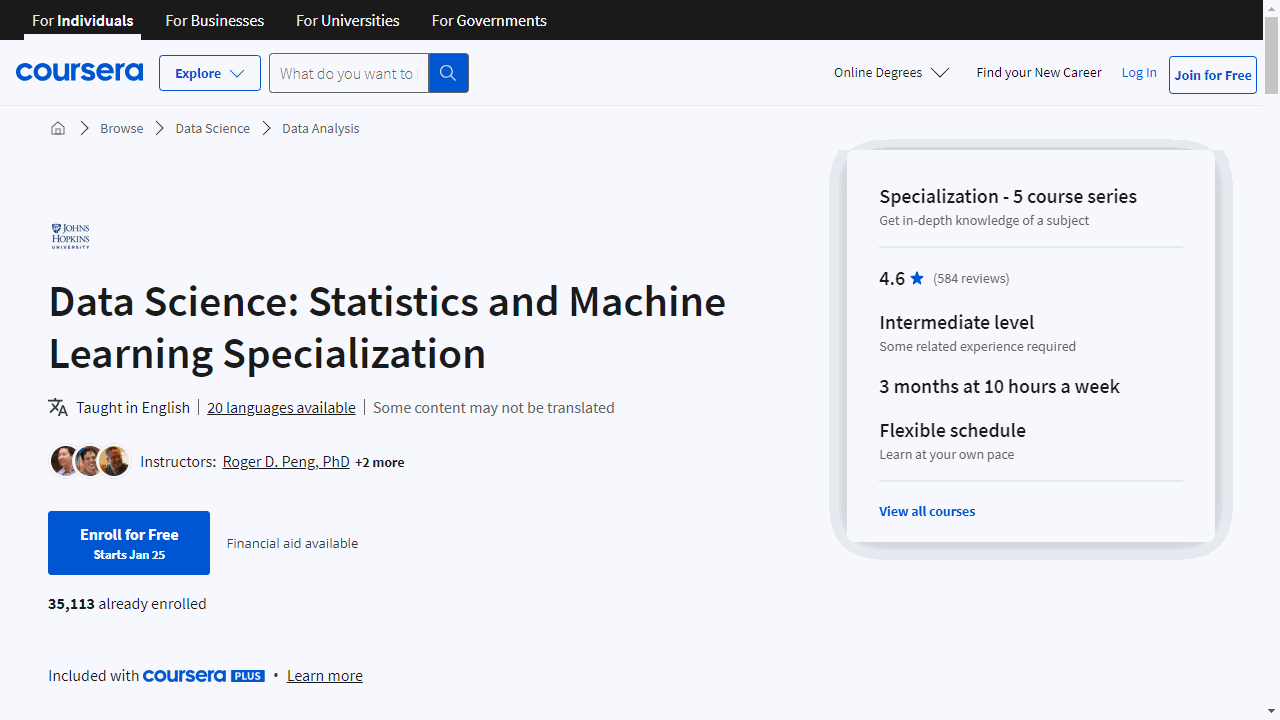
| Data Science: Statistics and Machine Learning Specialization | • Statistical Inference • Regression Modeling • Machine Learning |
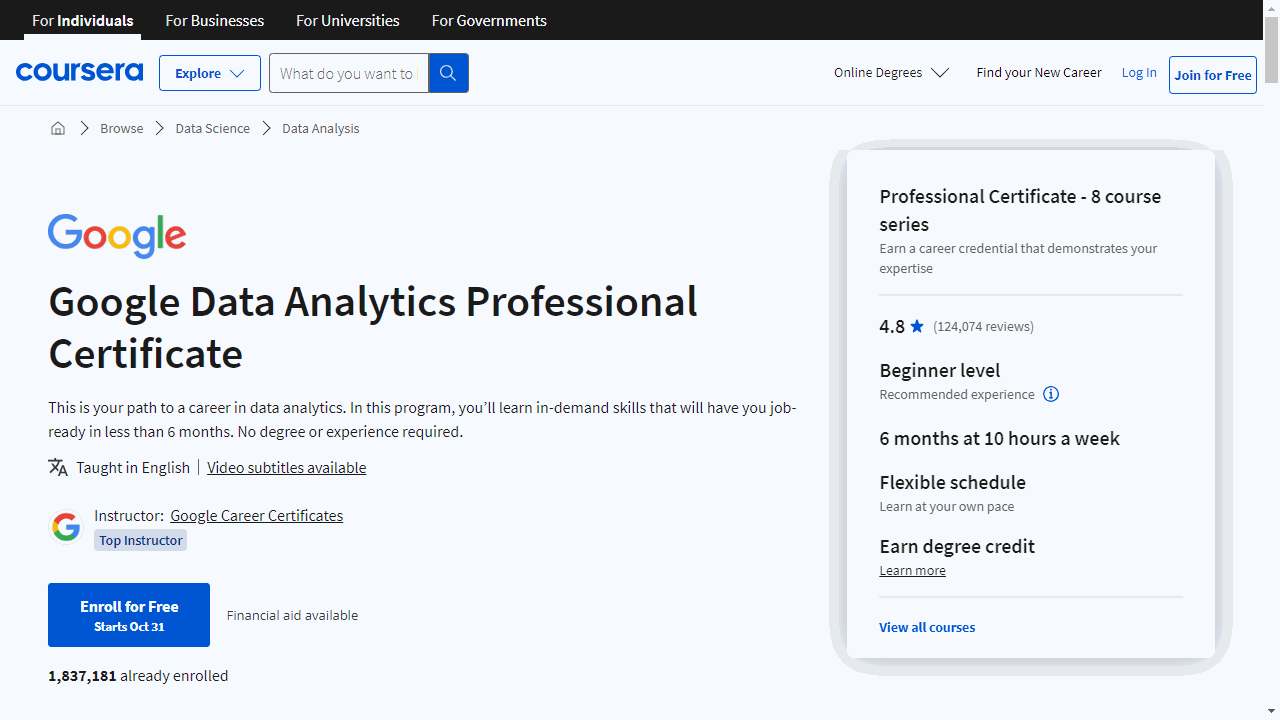
| Google Data Analytics Professional Certificate | • Analyze data • Visualize insights • Apply R |
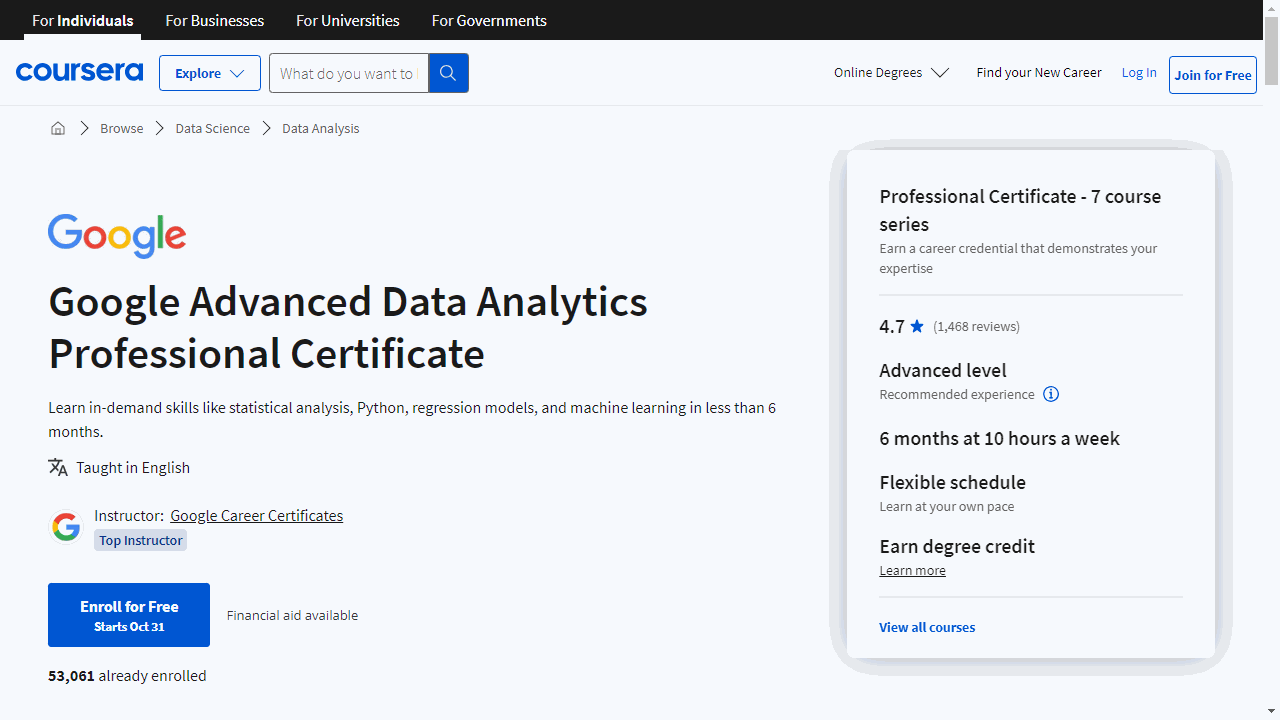
| Google Advanced Data Analytics Professional Certificate | • Data analysis • Machine learning • Data visualization |
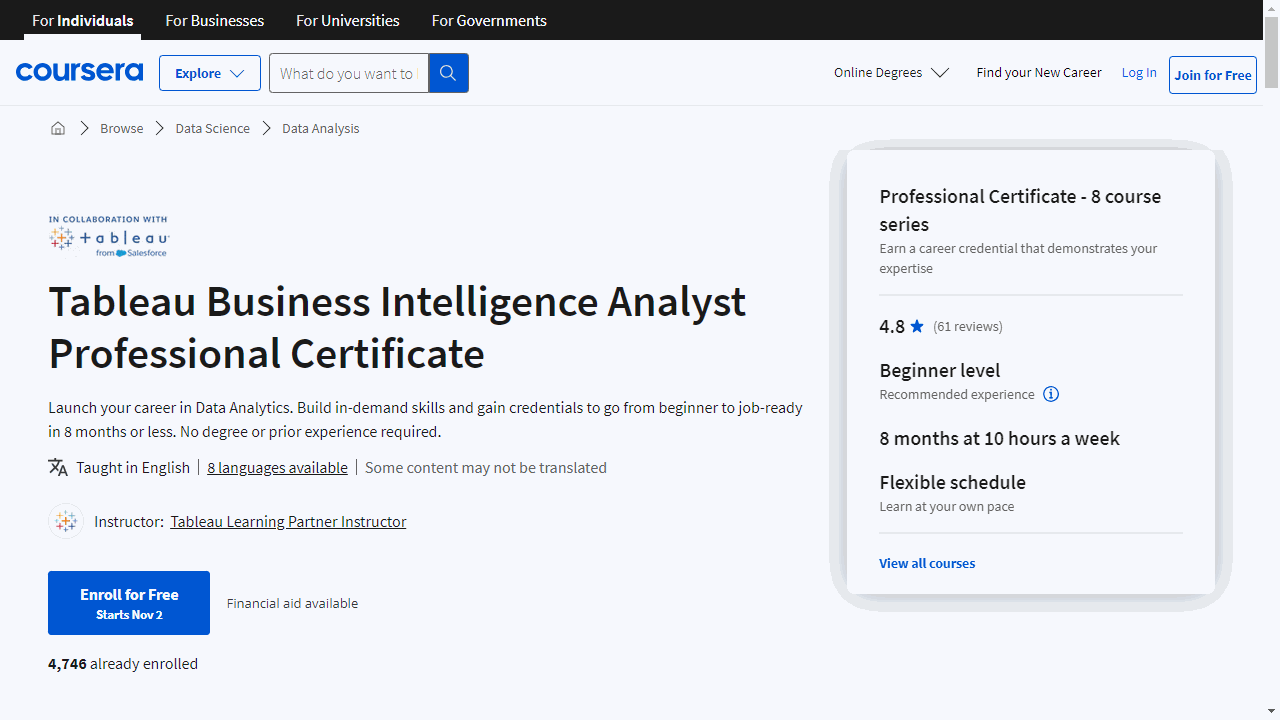
| Tableau Business Intelligence Analyst Professional Certificate | • Tableau data visualization • Business analysis process • Data storytelling |
IBM Data Science Professional Certificate
This comprehensive program covers all the essential topics and tools you need to kickstart your data science career.
It starts with an introduction to data science, explaining what it is, what data scientists do, and why it’s such an in-demand field.
You’ll learn about different career paths and get advice from experienced professionals.
Next, you’ll dive into the data scientist’s toolkit - libraries, packages, datasets, models, and tools like Jupyter Notebooks, RStudio, Git, and GitHub.
Getting hands-on experience with these tools is crucial for any aspiring data scientist.
The courses then guide you through the data science methodology, teaching you how to tackle any data science problem systematically.
You’ll learn techniques like exploratory data analysis, data wrangling, visualization, model building, and deployment.
Python programming is a core focus, with courses dedicated to using Python for data science, AI, and development.
You’ll learn Python basics, data structures, libraries like Pandas and NumPy, web scraping, and building dashboards.
A separate project course lets you apply these skills.
Databases and SQL are covered in-depth, ensuring you can extract and analyze data from relational databases.
Data analysis with Python teaches regression, classification, clustering algorithms, and creating data pipelines.
Data visualization is another key component, covering various plots, charts, word clouds, maps, and interactive dashboards using Matplotlib, Seaborn, Folium, Plotly, and Dash.
The machine learning course dives into supervised and unsupervised techniques like linear regression, logistic regression, KNN, decision trees, k-means, and hierarchical clustering.
Finally, the capstone project lets you put everything together by predicting rocket launch outcomes for a SpaceX competitor, following the full data science lifecycle.
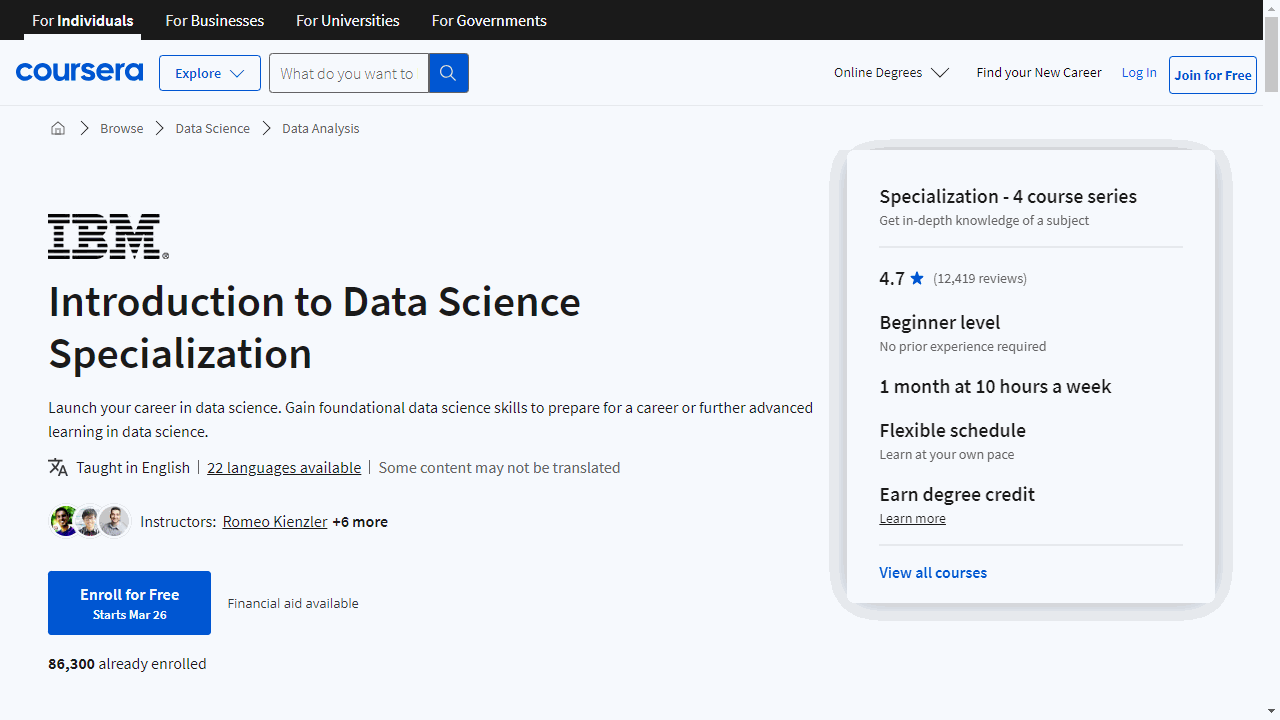
Introduction to Data Science Specialization
This specialization begins with the course “What is Data Science?”, which provides a comprehensive overview of the field.
You’ll learn the definition of data science, its importance in today’s data-driven world, and the various career paths available.
Seasoned data scientists share their insights and experiences, giving you a glimpse into the exciting world of uncovering insights and trends from data.
Next, you’ll dive into the “Tools for Data Science” course, where you’ll become familiar with the essential tools used by data professionals.
From Jupyter Notebooks and RStudio IDE to Git and GitHub for source code management, you’ll gain hands-on experience working with these powerful tools.
You’ll even learn to write code in Python, R, and Scala within cloud-based environments.
The “Data Science Methodology” course is a game-changer, teaching you the methodologies successful data scientists employ to tackle any data science scenario.
You’ll explore the Foundational Data Science Methodology and the six-stage CRISP-DM process, applying them to real-world inspired scenarios using Jupyter Notebooks and Python.
Finally, “Databases and SQL for Data Science with Python” equips you with the critical skill of working with databases using SQL.
You’ll learn to write SQL statements, create and manipulate tables, and perform advanced operations like joins and subqueries.
With hands-on labs and projects, you’ll practice querying real databases on the cloud and analyzing datasets using Python and SQL together.
Throughout the specialization, you’ll gain exposure to key data science concepts like machine learning, deep learning, data mining, and big data.
You’ll also develop proficiency in essential tools like Jupyter Notebooks, RStudio, Git, and cloud databases, making you well-prepared for a career in this exciting field.
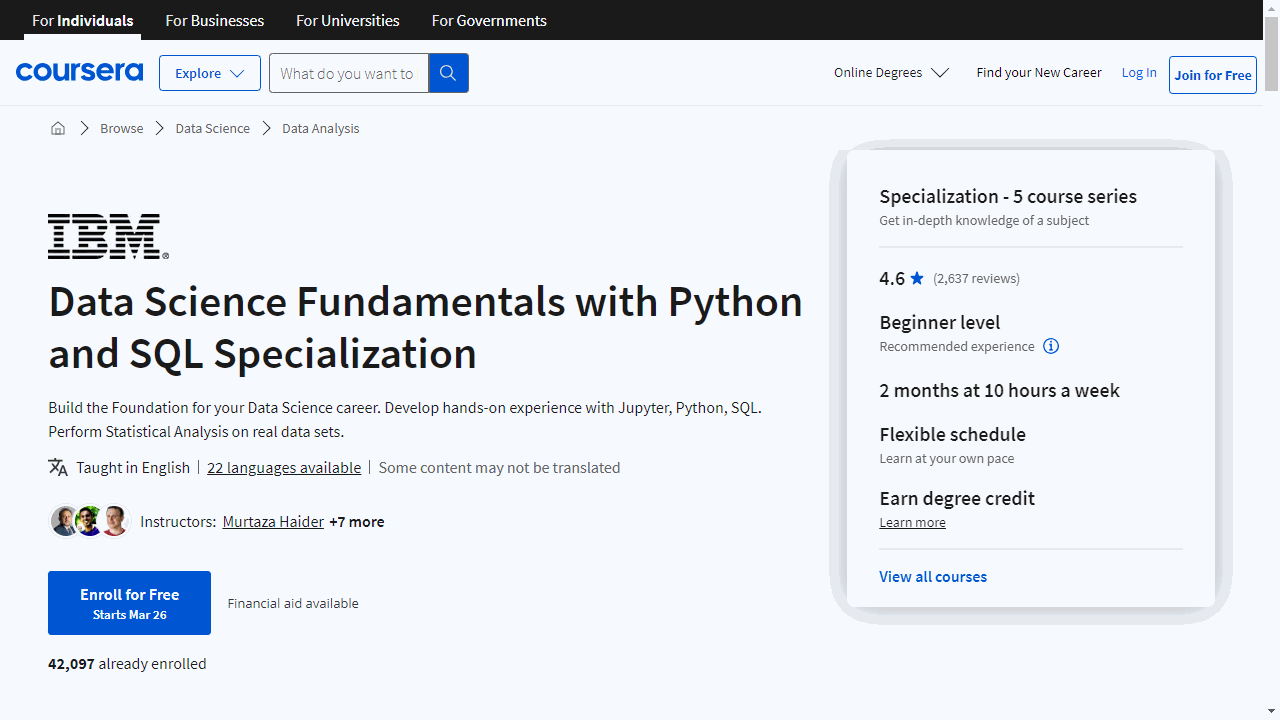
Data Science Fundamentals with Python and SQL Specialization
The first course, “Tools for Data Science,” introduces you to the data scientist’s toolkit, including libraries, packages, datasets, machine learning models, and various open-source, commercial, and cloud-based tools.
You’ll gain hands-on experience with Jupyter Notebooks, JupyterLab, RStudio IDE, Git, GitHub, and Watson Studio, learning how to use these tools effectively.
Next, “Python for Data Science, AI & Development” teaches you Python from scratch.
You’ll learn Python basics, data types, data structures, logic concepts, and work with popular libraries like Pandas, NumPy, and Beautiful Soup.
This course equips you with the Python skills needed for data science, AI, software development, and more.
The “Python Project for Data Science” course allows you to apply your Python knowledge to a real-world scenario.
You’ll play the role of a data scientist or data analyst, extracting data, web scraping, visualizing data, and creating a dashboard using Python, Pandas, Beautiful Soup, and Plotly within a Jupyter Notebook.
“Statistics for Data Science with Python” covers crucial statistical concepts like descriptive statistics, data visualization, hypothesis testing, ANOVA, regression, and correlation analysis.
You’ll learn to conduct statistical analyses using Python and Jupyter Notebooks, making it a practical course for data scientists and analysts.
Finally, “Databases and SQL for Data Science with Python” teaches you SQL, a must-have skill for data professionals.
You’ll learn to write SQL statements, create and manage databases, use advanced techniques like joins, views, and transactions, and integrate SQL with Python and Jupyter Notebooks.
Throughout the specialization, you’ll work with real-world datasets, complete hands-on projects, and gain practical experience using industry-standard tools like Jupyter Notebooks, Git, and cloud platforms.
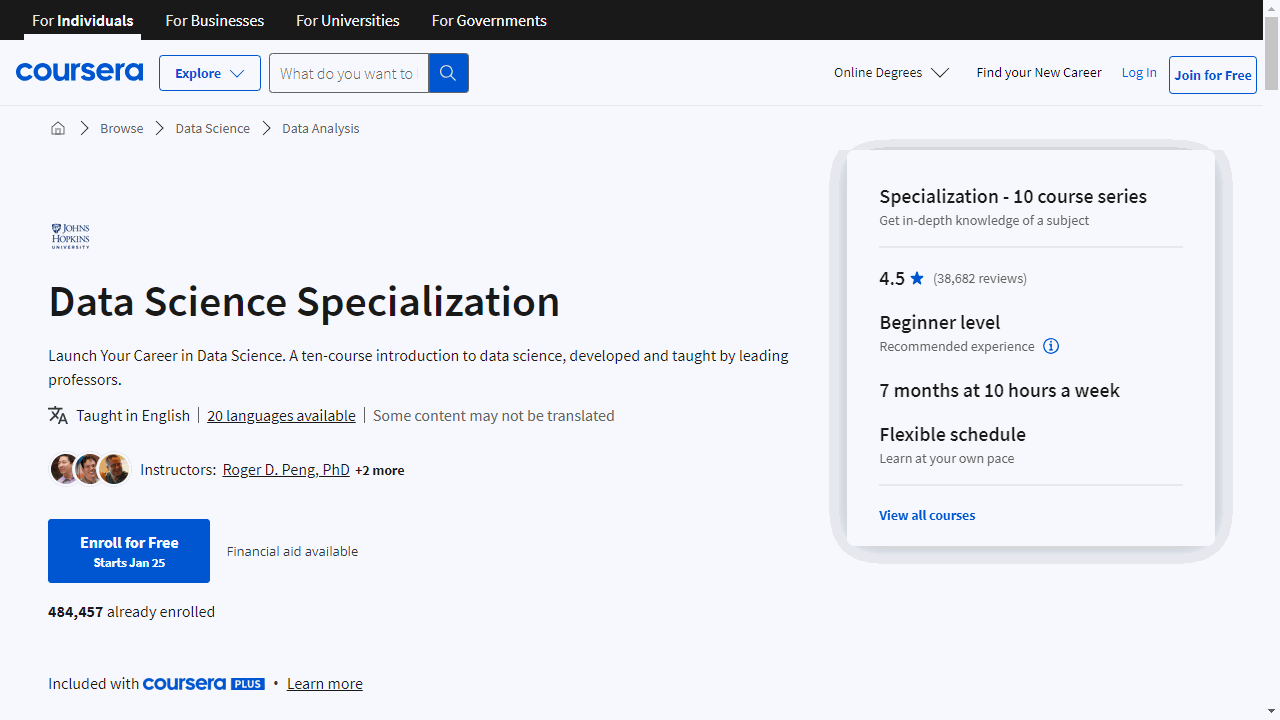
Data Science Specialization
This specialization is offered by Johns Hopkins University and covers the entire data science lifecycle, from data collection and cleaning to analysis, visualization, and reporting.
You’ll start with The Data Scientist’s Toolbox, introducing you to the data, questions, and tools that data analysts use.
You’ll set up R, RStudio, GitHub, and learn about study design concepts.
This lays the foundation for the rest of the specialization.
Next up is R Programming, where you’ll dive into programming in R for effective data analytics.
You’ll understand critical programming concepts, configure statistical software, use R loops and debugging tools, and learn to profile your code.
Getting and Cleaning Data teaches you to obtain data from various sources like the web, APIs, and databases.
You’ll also learn data cleaning basics to make your data “tidy” for faster analysis.
Exploratory Data Analysis covers essential techniques for summarizing data, including plotting systems in R. You’ll create graphics for high-dimensional data and apply cluster analysis to find patterns.
Reproducible Research focuses on reporting analyses reproducibly using literate programming tools like knitr and Markdown.
You’ll learn to organize, write up, and publish reproducible web documents.
Statistical Inference introduces the process of drawing conclusions from data using frequentist, Bayesian, and other theories.
You’ll understand variability, distributions, p-values, confidence intervals, and make informed analysis decisions.
In Regression Models, you’ll master regression analysis, least squares, inference using regression models, ANOVA, ANCOVA, and analysis of residuals.
You’ll also explore novel uses like scatterplot smoothing.
Practical Machine Learning covers building and applying prediction functions, including training/test sets, overfitting, error rates, and algorithms like regression, classification trees, Naive Bayes, and random forests.
Finally, in Developing Data Products and the Capstone, you’ll create usable data products using Shiny, R packages, and interactive graphics, showcasing your skills to potential employers.
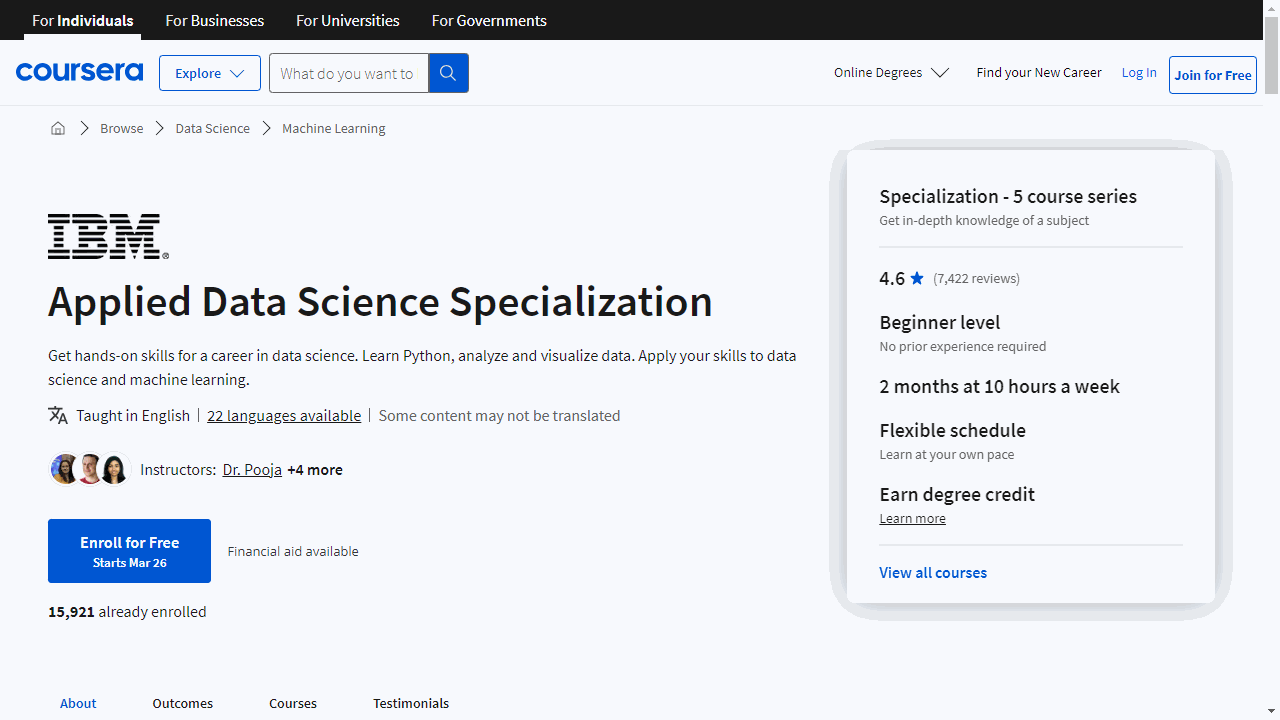
Applied Data Science Specialization
The first course, Python for Data Science, AI & Development, teaches you the fundamentals of Python programming from scratch.
You’ll learn data types, structures like lists and tuples, logic concepts, and work with libraries like Pandas, Numpy, and BeautifulSoup.
Through hands-on labs using Jupyter Notebooks, you’ll practice data collection, web scraping, and basic programming skills essential for data science roles.
Next up is the Python Project for Data Science course, where you’ll apply your Python knowledge to a real-world scenario as a data scientist or analyst.
You’ll extract data, scrape websites, visualize findings, and create dashboards using Pandas, Beautiful Soup, and Plotly within Jupyter Notebooks.
This project-based course lets you showcase your Python proficiency.
The Data Analysis with Python course dives deeper into analyzing data using Python.
From data cleaning and wrangling to exploratory analysis and visualization, you’ll master techniques with Pandas, Numpy, and data visualization libraries.
You’ll also build and evaluate machine learning regression models, create data pipelines using scikit-learn, and learn how to make predictions.
Data Visualization with Python focuses on storytelling through visualizations.
Using libraries like Matplotlib, Seaborn, Folium, and Plotly, you’ll create various charts, plots, word clouds, maps, and interactive dashboards.
These skills are crucial for effectively communicating insights from data.
Finally, the Applied Data Science Capstone lets you practice an end-to-end data science project.
You’ll collect, wrangle, analyze, and visualize data related to SpaceX’s Falcon 9 rocket launches.
You’ll develop machine learning models like support vector machines, decision trees, and k-nearest neighbors to predict rocket landing success.
This capstone project showcases your data science skills for potential employers.
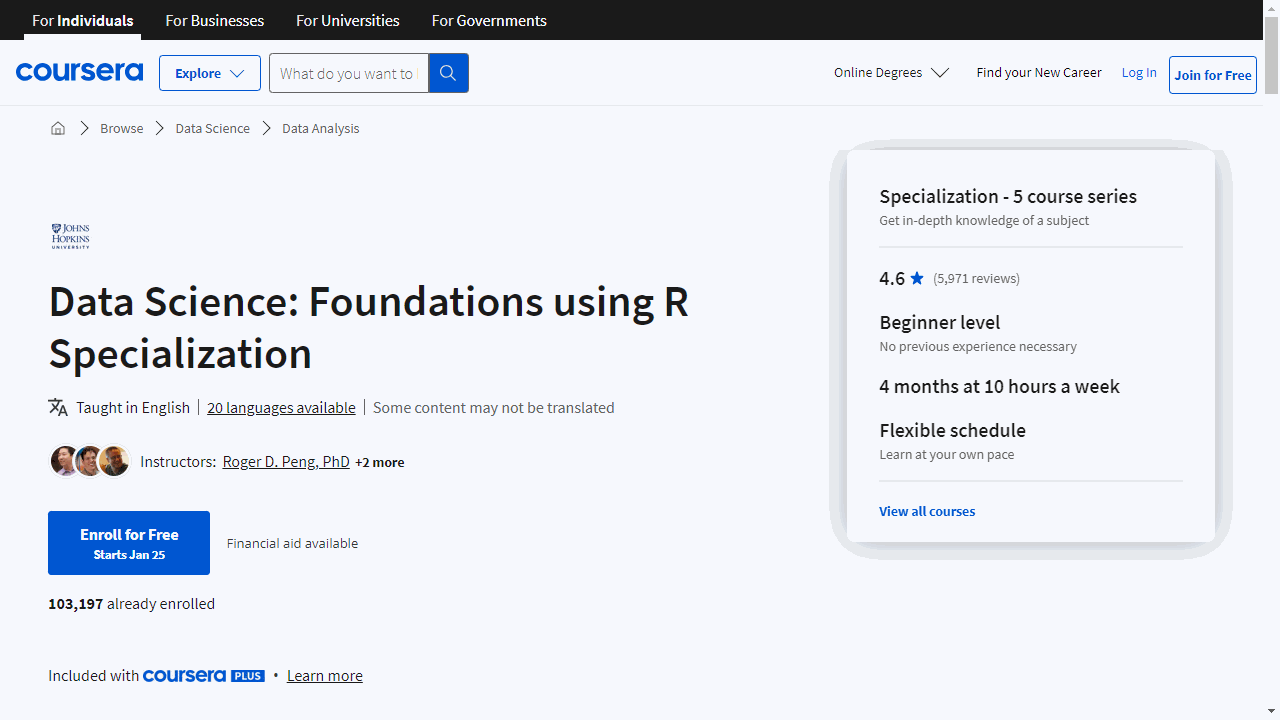
Data Science: Foundations using R Specialization
The first course, The Data Scientist’s Toolbox, introduces you to the essential tools and concepts in a data scientist’s toolkit.
You’ll learn how to set up R, RStudio, GitHub, and other useful tools.
Additionally, you’ll gain an understanding of the data, problems, and tools that data analysts use, as well as study design concepts.
By the end, you’ll know how to create a GitHub repository.
Next up is R Programming, where you’ll dive into programming in R and using it for effective data analysis.
You’ll learn how to install and configure software for statistical programming, understand programming language concepts as implemented in R, and work with practical issues like reading data into R, accessing packages, writing functions, debugging, and organizing code.
In Getting and Cleaning Data, you’ll learn how to obtain data from various sources like the web, APIs, databases, and colleagues in different formats.
Importantly, you’ll also learn the basics of data cleaning and how to make data “tidy,” which greatly speeds up downstream analysis tasks.
You’ll use R for text and date manipulation too.
Exploratory Data Analysis teaches you essential techniques for summarizing data, typically applied before formal modeling.
You’ll master plotting systems in R, principles of constructing data graphics, and multivariate statistical techniques for visualizing high-dimensional data.
This includes advanced graphing systems like ggplot2 and cluster analysis to locate patterns.
Finally, Reproducible Research focuses on reporting modern data analyses in a reproducible manner.
You’ll learn how to organize analyses for reproducibility, write them up using knitr, determine reproducibility, and publish web documents using Markdown.
This allows others to verify findings and build upon your work.
With this specialization, you’ll gain a solid foundation in data science using R, covering everything from programming and data wrangling to exploratory analysis, visualization, and reproducible research practices.
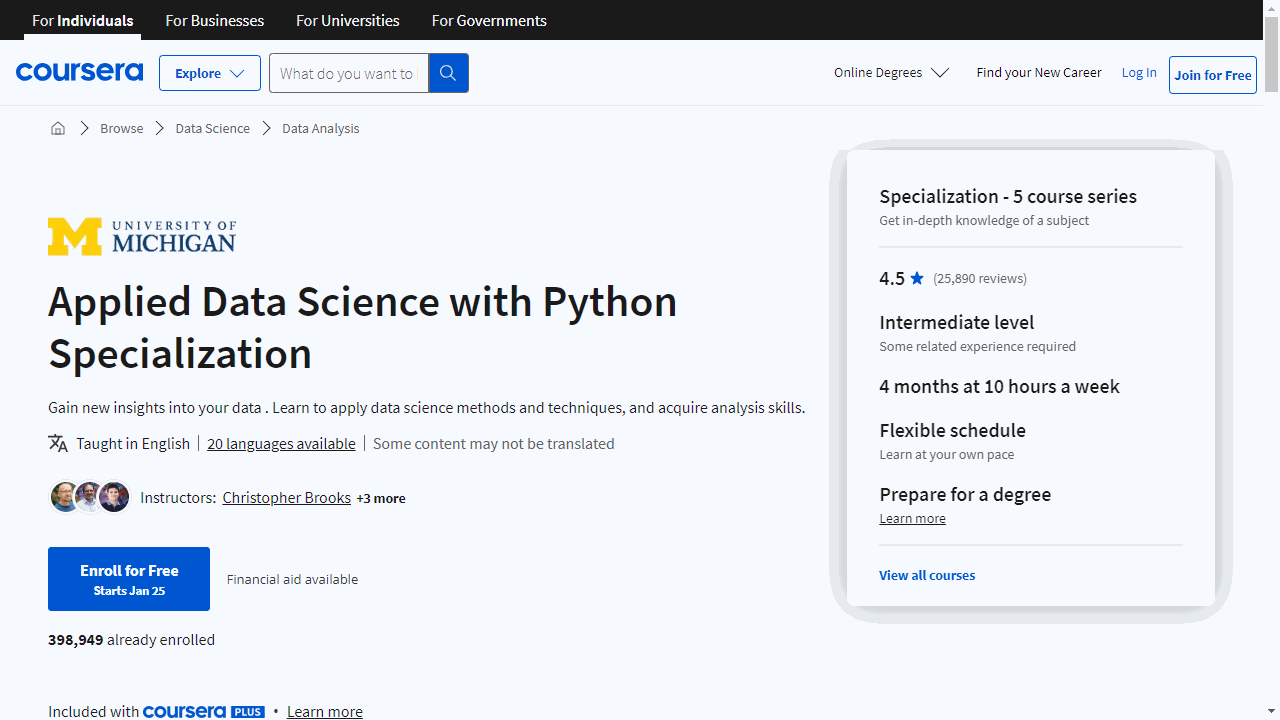
Applied Data Science with Python Specialization
You’ll start with the Introduction to Data Science in Python course, covering the basics of the Python programming environment, data manipulation with Pandas, and running statistical analysis.
You’ll learn techniques like working with CSV files, using NumPy, and understanding distributions and t-tests.
Next up is Applied Plotting, Charting & Data Representation in Python.
This course focuses on data visualization using Matplotlib.
You’ll learn best practices for creating effective charts and identifying the right visualization methods for your data.
The third course, Applied Machine Learning in Python, dives into machine learning techniques using scikit-learn.
You’ll learn how to cluster data, build predictive models, handle issues like overfitting, and engineer relevant features for your analysis needs.
If you’re interested in text data, Applied Text Mining in Python covers cleaning, processing, and analyzing text using NLTK and natural language processing methods like text classification and topic modeling.
Finally, Applied Social Network Analysis in Python uses the NetworkX library to represent and analyze network data.
You’ll explore concepts like network connectivity, node centrality, and predicting network evolution over time.
Throughout the specialization, you’ll gain hands-on experience with Python libraries like Pandas, NumPy, Matplotlib, scikit-learn, and NLTK.
The courses build on each other, so you can develop a comprehensive skillset in data science using Python.
Whether you want to visualize data, build machine learning models, analyze text, or study networks, this specialization, offered by the University of Michigan, has you covered.
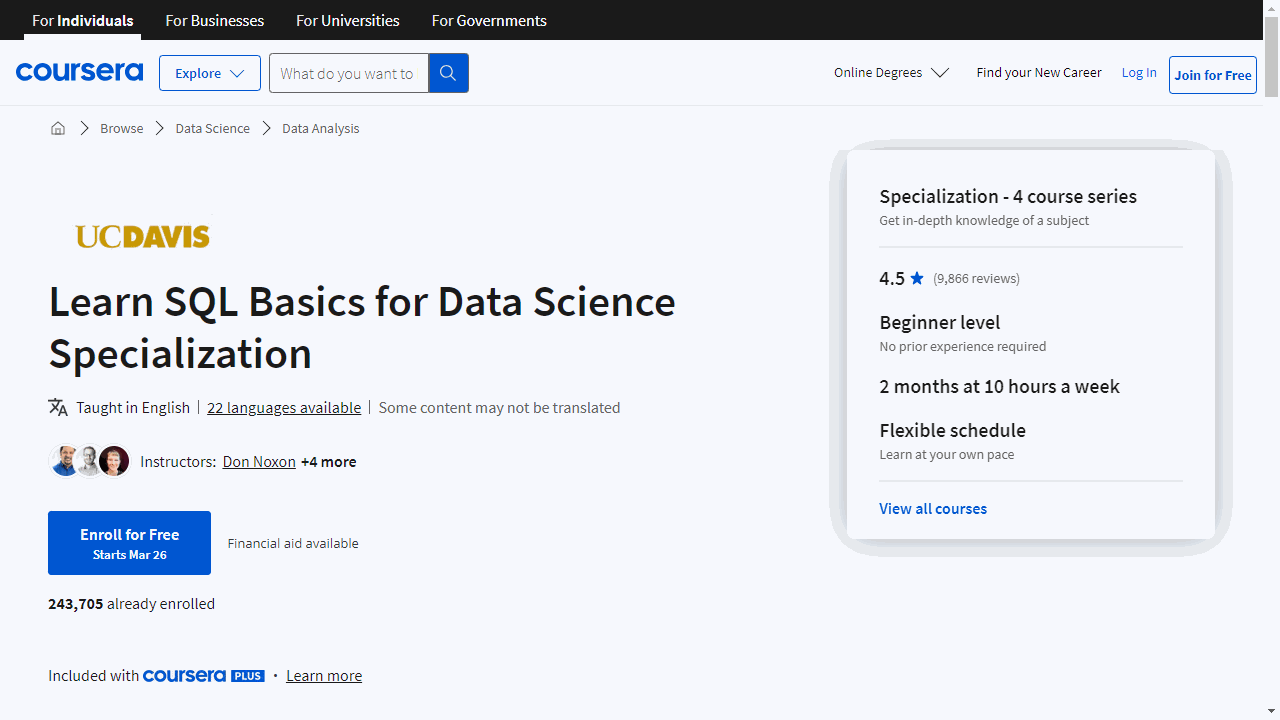
Learn SQL Basics for Data Science Specialization
This specialization covers the fundamentals of SQL, which is essential for anyone aspiring to become a data scientist.
The first course, SQL for Data Science, serves as an excellent primer on SQL.
It starts from the very basics, assuming no prior knowledge, and gradually builds your skills in writing queries to select, filter, and manipulate data from tables.
You’ll learn how to work with different data types like strings and numbers, create new tables, combine data using operators, and even touch on concepts like data governance and profiling.
With a rating of 4.6 and over 15,000 ratings, this course is a solid foundation.
The second course, Data Wrangling, Analysis and AB Testing with SQL, allows you to apply your SQL skills to real-world case studies.
You’ll learn techniques like converting timestamps, performing optimal JOINs, data cleaning, segmentation using windowing functions, and even engineering features for predictive analytics.
The course also covers A/B testing frameworks, giving you practical experience.
If you want to take your SQL skills to the next level for big data, the third course, Distributed Computing with Spark SQL, is a great choice.
You’ll dive into the open-source Apache Spark framework and learn how to work with large datasets using distributed computing.
From understanding Spark’s architecture to optimizing queries and building reliable data pipelines with Delta Lake, this course prepares you for advanced data analysis at scale.
Finally, the SQL for Data Science Capstone Project lets you put all your skills into practice by choosing a dataset, developing a proposal, performing exploratory analysis, creating metrics, and presenting your findings.
The peer-review process provides valuable feedback to refine your data analysis approach using SQL.
With a focus on hands-on projects, real-world case studies, and covering essential tools like SQL, Apache Spark, and Delta Lake, this specialization equips you with the skills needed to excel as a data scientist.
The courses are well-rated, and the content is designed to take you from the basics to advanced techniques in a structured manner.
Executive Data Science Specialization
The specialization kicks off with “A Crash Course in Data Science” which gives you a rapid introduction to the field without getting too technical.
You’ll learn how data science plays a role in organizations, the key terms and tools used, and how to identify successful projects.
Next up is “Building a Data Science Team” where you’ll dive into the different roles like data scientist and engineer, how to interview candidates, onboard new hires, and empower your team for success.
The third course “Managing Data Analysis” covers the iterative data analysis process - from defining questions to exploratory analysis, modeling, interpretation and communication.
You’ll learn to direct analytic activities cohesively.
“Data Science in Real Life” contrasts the ideal scenario with real-world challenges like messy data pulls, violated modeling assumptions, and communication pitfalls.
This prepares you for a typical day managing data analysis.
Finally, the capstone project lets you apply your learnings to a virtual scenario developed with Zillow.
You’ll lead a data science team, make key decisions, and deliver a final presentation evaluated by peers.
Throughout, you’ll gain insights into experimental design, causal inference, managing data quality, machine learning vs classical statistics - all essential skills for an effective data science manager.
The courses use simple language and real examples to make complex concepts accessible.
Data Science: Statistics and Machine Learning Specialization
The first course, Statistical Inference, introduces you to the fundamentals of drawing conclusions from data.
You’ll learn about variability, distributions, confidence intervals, and hypothesis testing using p-values and permutation tests.
This knowledge is crucial for making informed decisions when analyzing data.
Next, Regression Models delves into the world of linear models, a powerful tool for relating outcomes to predictors.
You’ll explore regression analysis, ANOVA, ANCOVA, and techniques like residual analysis and scatterplot smoothing.
These skills are invaluable for understanding and modeling complex relationships in data.
Practical Machine Learning is where you’ll dive into the exciting realm of prediction and machine learning algorithms.
You’ll learn about training and test sets, overfitting, error rates, and various methods like regression, classification trees, Naive Bayes, and Random Forests.
This course equips you with the ability to build and evaluate prediction functions, a core task for data scientists.
In Developing Data Products, you’ll learn how to create interactive data visualizations and applications using tools like Shiny, R packages, and Plotly.
This course focuses on telling compelling stories with data, a crucial skill for effectively communicating your findings to a wide audience.
Finally, the Data Science Capstone project allows you to apply your skills to a real-world problem.
You’ll create a usable data product, showcasing your expertise in exploratory data analysis, model selection, and prediction.
This hands-on experience is invaluable for demonstrating your abilities to potential employers.
Throughout the specialization, you’ll gain proficiency in various programming languages and tools, such as R and Natural Language Processing.
You’ll also explore advanced concepts like Bayesian inference, missing data handling, and model selection techniques, equipping you with a comprehensive understanding of the data science landscape.
Google Data Analytics Professional Certificate
If you’re searching for the best courses in data science, the Google Data Analytics Certificate on Coursera is a fantastic option.
This program is a comprehensive suite of eight courses that cover everything from the foundations of data analytics to the application of R programming.
The first course, “Foundations: Data, Data, Everywhere,” is a great starting point. It introduces you to the world of data analytics and provides an overview of the key analytical skills and tools you’ll need, such as data cleaning, data analysis, and data visualization.
The course is taught by current Google data analysts, which gives you a real-world perspective on the subject matter.
The second course, “Ask Questions to Make Data-Driven Decisions,” builds on the first course and focuses on the importance of questioning and decision-making in data analysis, which is often overlooked in similar courses.
The third course, “Prepare Data for Exploration,” introduces you to new topics that will help you gain practical data analytics skills.
You’ll learn how to use tools like spreadsheets and SQL to extract and make use of the right data for your objectives.
The fourth course, “Process Data from Dirty to Clean,” teaches you how to check and clean your data using spreadsheets and SQL.
This course stands out because it focuses on the importance of data integrity and provides you with hands-on ways to accomplish common data analyst tasks.
The fifth course, “Analyze Data to Answer Questions,” explores the “analyze” phase of the data analysis process.
You’ll learn how to organize and format your data using spreadsheets and SQL to help you look at and think about your data in different ways.
The sixth course, “Share Data Through the Art of Visualization,” shows you how data visualizations can help bring your data to life.
You’ll also explore Tableau, a data viz platform that will help you create effective visualizations for your presentations.
The seventh course, “Data Analysis with R Programming,” introduces you to the programming language known as R.
I would prefer you take a course in Python, but R is still a great language to learn for data analysis.
It’s the second most popular programming language for data analysis, after Python, and this course will teach you how to use it for data analysis.
You’ll discover how R lets you clean, organize, analyze, visualize, and report data in new and more powerful ways.
The final course, “Google Data Analytics Capstone: Complete a Case Study,” gives you the opportunity to apply what you’ve learned in a real-world context.
You’ll choose an analytics-based scenario and complete a case study, which is a great way to showcase your skills to potential employers.
Overall, the Google Data Analytics Certificate is a comprehensive and practical program that equips you with the skills needed to apply for introductory-level data analyst jobs.
The courses are well-structured, engaging, and taught by industry professionals.
Google Advanced Data Analytics Professional Certificate
This program is a comprehensive suite of seven courses that cover everything from the foundations of data science to advanced machine learning techniques.
It’s a great option to consider after completing the previous course, as it builds on the skills and knowledge you’ve gained in that program.
The first course, Foundations of Data Science, sets the stage for your learning journey.
It introduces you to the role of data professionals and the project workflow PACE (Plan, Analyze, Construct, Execute). This course is unique because it’s taught by Google employees who work in the field, providing you with real-world examples and hands-on activities.
Next, you’ll dive into Python programming in the Get Started with Python course.
Python is a powerful tool for data analysis, and this course will teach you the basics, from variables and data types to loops and data structures.
The third course, Go Beyond the Numbers: Translate Data into Insights, teaches you how to find the story within data and communicate it effectively. You’ll practice exploratory data analysis and learn how to create compelling data visualizations.
The Power of Statistics, the fourth course, introduces you to the use of statistics in data science.
You’ll explore key concepts like probability, sampling, confidence intervals, and hypothesis testing, all while using Python for statistical analysis.
In the fifth course, Regression Analysis: Simplify Complex Data Relationships, you’ll learn about different methods of data modeling, including linear regression, analysis of variance (ANOVA), and logistic regression.
This course will help you understand how data professionals use regression analysis to discover relationships between variables and identify key factors affecting business performance.
The sixth course, The Nuts and Bolts of Machine Learning, delves into the world of machine learning.
You’ll learn about supervised and unsupervised learning, and how to apply different machine learning models to business problems.
Finally, the Google Advanced Data Analytics Capstone course gives you the opportunity to apply everything you’ve learned in a capstone project.
This is a great way to showcase your new skills and knowledge.
Tableau Business Intelligence Analyst Professional Certificate
This comprehensive 8-course Professional Certificate from Coursera can give you the hands-on training you need to succeed with Tableau.
These courses take you step-by-step through the key concepts, tools, and techniques used by business analysts.
You’ll start by building a strong foundation in analytics and data literacy. Then you’ll dive into the business analysis process, learning how to assess problems, gather requirements, and implement solutions.
Crucially, you’ll also gain expertise in Tableau - one of the industry-leading platforms for interactive data visualization.
Through hands-on projects, you’ll master data preparation, visualization design, dashboard creation, and data storytelling. These are pivotal skills for communicating insights and engaging stakeholders.
Other standout features include:
- Practical modules on managing data ecosystems and architecture principles
- Techniques for advanced visualizations like dual-axis charts and maps
- Data manipulation and analytics features to enhance analysis
- Design principles for crafting compelling, interactive presentations
By the end, you’ll have real-world skills to tackle business intelligence challenges.
The certificate can qualify you for entry-level analyst roles or help you stand out for promotions. Plus, you can learn at your own pace, on any device.
Also check our post on the best Data Science courses on Udacity, our post on the best Data Science courses on Udemy, and our post on the best Data Science courses on any provider.
