Streamlit is a powerful Python library that lets you effortlessly create interactive web apps for data visualization and machine learning projects.
With Streamlit, you can build dashboards, prototypes, and even full-fledged applications, all without needing extensive web development experience.
Learning Streamlit opens doors to exciting career opportunities in data science, machine learning, and software development.
Finding a high-quality Streamlit course on Udemy can be overwhelming, especially with so many options available.
You’re looking for a course that’s comprehensive, engaging, and taught by experts, but also fits your learning style and goals.
We’ve carefully reviewed numerous Udemy courses and have identified Learn Streamlit Python as the best overall course.
This comprehensive course takes you from zero to hero in building Streamlit apps, covering a wide range of topics, including data visualization, interactive widgets, building real-world projects, and deployment.
While Learn Streamlit Python is our top pick, there are other great options available on Udemy catering to different learning levels and specific interests.
Keep reading to explore our full list of recommendations and find the perfect Streamlit course for your journey!
Learn Streamlit Python

You’ll start by understanding what Streamlit is and why it’s beneficial for creating data-driven apps.
The course covers the Streamlit API, installation, and setting up a virtual environment.
You’ll learn how to display text, DataFrames, tables, and JSON data using Streamlit’s write function.
The course dives into working with various widgets like buttons, checkboxes, sliders, and text inputs to create interactive user interfaces.
You’ll also explore displaying media files like images, audio, and videos within your Streamlit apps.
The course dedicates sections to data visualization using popular libraries like Matplotlib, Plotly, and Altair.
You’ll learn how to create bar charts, area charts, and interactive plots seamlessly within Streamlit.
Additionally, the course covers working with Streamlit components, customizing themes, and building multi-page apps.
A significant portion of the course focuses on building real-world projects, including NLP apps for text summarization and analysis, metadata extraction apps, machine learning apps like a diabetes prediction model, and CRUD (Create, Read, Update, Delete) apps like a TaskList app and a ToDo app.
You’ll gain hands-on experience structuring apps, adding functionality, and deploying them using services like Streamlit Sharing, Docker, Google Cloud Platform, and Heroku.
The course also explores advanced topics like session state management, load testing, and managing Streamlit apps with PM2.
You’ll build exciting projects like a Zodiac Predictor, Morse Code App, Upside Down Text App, and even a Monkey Pox Multi-Page App.
The course covers using maps with Plotly and Pydeck, integrating LLMs (Large Language Models) like GPT4All and Ollama for chatbots, and working with PyGWalker for data visualization.
Streamlit Bootcamp
The course starts with an introduction that covers the key learning outcomes, so you know exactly what you’ll be learning.
It then guides you through the installation and setup process, ensuring you have everything you need to get started.
You’ll dive into working with text elements in Streamlit, learning about different types of text elements and how to use them effectively.
From there, the course moves on to data display elements, teaching you how to work with DataFrames and tables, as well as how to display JSON data.
One of the standout features of this course is its focus on chart elements.
You’ll learn how to create line charts, area charts, bar charts, and even work with Pyplot for more advanced visualizations.
These skills are essential for building data-driven applications with Streamlit.
The course also covers input widgets, which are crucial for creating interactive applications.
You’ll learn how to use buttons, download buttons, checkboxes, radio buttons, select boxes, sliders, text inputs, number inputs, and date inputs.
These widgets allow you to gather user input and create dynamic applications.
Moving on, you’ll explore media items in Streamlit, including working with images and videos.
This is particularly useful if you’re building applications that require multimedia elements.
The course also covers layouts and containers, which are essential for organizing your application’s user interface.
You’ll learn how to use sidebars, columns, and expanders to create a visually appealing and user-friendly layout.
Finally, the course includes several projects that allow you to apply what you’ve learned.
These projects include an insurance premium predictor app, a calories burned calculator app (split into two parts), and a stock market index prediction app.
Working on these projects will solidify your understanding of Streamlit and give you practical experience in building real-world applications.
Machine Learning Model Deployment with Streamlit
You’ll start with an introduction to Streamlit, learning how to install and set it up.
The course then dives into the fundamentals, teaching you how to create basic Streamlit apps and work with text elements, data display, charting, and input widgets.
You’ll also learn about forms and customizing the layout of your apps.
One of the highlights is the capstone project where you’ll build an interactive dashboard, applying the skills you’ve learned.
The course also covers essential concepts like caching to optimize performance and state management to handle user interactions effectively.
You’ll get hands-on experience with multipage applications, a common requirement for real-world projects.
The course even covers authentication, teaching you how to implement basic authentication and use the Streamlit-Authenticator library.
Connecting to data sources is another important topic covered.
You’ll learn how to connect to databases like Supabase and make API calls to fetch data for your apps.
Throughout the course, you’ll work on several capstone projects, such as deploying classification and regression models, building a temperature conversion calculator, training and ranking different classification models, implementing clustering for a marketing campaign, and deploying a demand forecasting model.
The course wraps up with a section on deploying your Streamlit apps to production, covering the deployment process, advanced concepts, and handling secrets.
Learn & Deploy Data Science Web Apps with Streamlit
The course “Learn & Deploy Data Science Web Apps with Streamlit” is an excellent choice if you’re looking to build interactive data science applications.
You will start by learning the fundamentals of Streamlit.
The course covers installing the necessary tools like Python, Streamlit, and VS Code with relevant extensions.
Once you have the setup ready, you’ll dive into Streamlit’s APIs and learn how to display various elements like text, data, status indicators, images, videos, and audio.
The course also teaches you to create layouts using columns, expanders, and containers, making your app visually appealing.
A significant part of the course focuses on building interactive visualizations using popular libraries like Matplotlib, Seaborn, Pandas, Plotly, and Bokeh.
You’ll learn how to integrate these libraries with Streamlit and create interactive charts controlled by input widgets like buttons, sliders, and dropdowns.
The course includes a project where you’ll develop and deploy an Automatic Data Profiling App.
You’ll learn to upload CSV files, generate data profile reports, add input widgets for customization, and validate file types and sizes.
Additionally, you’ll use Git and GitHub to push your code and deploy the Streamlit app.
Throughout the course, you’ll work on assignments and practice tests to reinforce your learning.
The course also covers Flask and Django, allowing you to compare them with Streamlit and understand their differences.
You’ll learn Streamlit, a powerful tool that simplifies web app development, and gain hands-on experience building and deploying a real-world project.
Complete Guide to Data Science Applications with Streamlit
You’ll start by learning the fundamentals of Python, including data types, control structures, and functions.
The course then dives into essential data science libraries like NumPy for numerical computing and Pandas for data manipulation.
With a solid foundation in Python and data wrangling, you’ll explore data visualization using popular libraries like Matplotlib, Seaborn, Plotly, and Altair.
You’ll learn to create various plots, customize them, and integrate them into Streamlit apps.
The course covers advanced visualization techniques like subplots, animations, and interactive charts.
Moving beyond visualization, you’ll delve into Natural Language Processing (NLP) tasks such as sentiment analysis, question answering, text generation, and summarization.
This will allow you to build intelligent applications that can understand and process human language.
Throughout the course, you’ll learn how to add interactivity to your Streamlit apps using widgets like input boxes, sliders, and dropdowns.
This will enable you to create dynamic and user-friendly applications.
The course also covers essential skills like package management with pip and Anaconda, working with virtual environments, and deploying your Streamlit applications to platforms like Heroku and Streamlit Sharing.
From data loading and preprocessing to visualization and NLP, this course equips you with the skills to tackle real-world data science challenges using Streamlit.
Build a Generative AI Micro-SaaS App with Python & Streamlit
The course covers building a Generative AI Micro-SaaS App with Python & Streamlit, and the syllabus is packed with valuable content.
You’ll start with an introduction to Streamlit, setting up your development environment, and learning about interactivity, widgets, layouts, and session state.
Then, you’ll dive into building a ChatGPT-like clone with Streamlit and OpenAI, integrating open-source models into your chatbot.
The course then moves on to building a Streamlit Micro-SaaS app, covering app showcases, demos, Stripe integration, MongoDB user databases, email verification with FastAPI, and deployment to platforms like Railway.io or Streamlit Cloud.
You’ll even learn how to customize your domain name.
The course also covers multimodal Gen-AI with photos, audio, and video using OpenAI and Replicate.com.
You’ll build an automated Facebook post with GPT-4 Vision, create a TikTok video with GPT-4-V Vision and OpenAI Voices Client, optimize SEO ALT text for images, and explore AI photo editing and upscaling.
The main course project is an AI Tenant Management System, where you’ll set up AWS S3, Google Tesseract, Poppler, and a Conda environment.
You’ll learn about utility functions, coding the main tenant application portal, and deploying to Railway.
The project also covers analyzing tenant documents with the OpenAI API, creating an EmbedChain chatbot, and summarizing AI analysis.
Additionally, the course covers landing page creation, pain point marketing, and bootstrapping.
You’ll learn about platforms like Carrd, Mixo.io, and EmailOctopus, as well as marketing strategies and examples from Reddit.
YOLO-NAS, OpenAI, SAM with WebApps using Flask and Streamlit
You will start by learning about YOLO-NAS, a new object detection model.
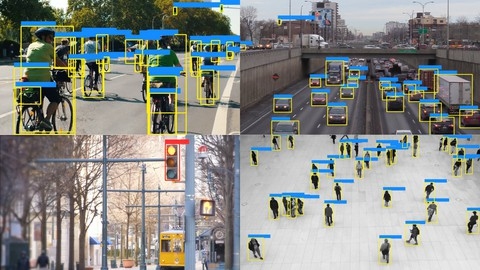
The course dives deep into implementing YOLO-NAS for object detection on images, videos, and even live webcam feeds.
It also covers integrating YOLO-NAS with object tracking algorithms like DeepSORT and SORT for applications like vehicle counting.
The course then moves on to building Streamlit web applications using YOLO-NAS.
You’ll learn how to create user interfaces for object detection on images and videos using Streamlit.
Additionally, you’ll build apps for specific use cases like vehicle counting, empty shelf detection, and license plate recognition.
Another key aspect is integrating YOLO-NAS with Flask to create web applications.
The course walks you through the process step-by-step, covering everything from setting up the environment to deploying the final app.
Interestingly, the course also explores the use of OpenAI models in conjunction with YOLO-NAS and Streamlit.
You’ll build applications like an article generator and a recipe generator using OpenAI’s language models.
Finally, the course introduces you to the Segment Anything Model (SAM) and shows you how to combine it with YOLO-NAS for image segmentation tasks.
Throughout the course, you’ll work with various libraries and tools like OpenCV, EasyOCR, PaddleOCR, and Google Colab.
Express Streamlit Industry Guide: App Online in < 3 hours
The course starts with an introduction that welcomes you and sets the stage for what you’ll learn.
It gives you a chance to get to know the instructor and other students, building a sense of community right from the beginning.
One of the key motivations for taking this course is to learn Streamlit, a powerful tool for building data apps quickly.
The syllabus promises a fast kick-off, so you can start launching apps locally in no time.
This hands-on approach is great for those who want to dive right in and start applying what they learn.
A unique aspect of this course is the inclusion of tech and data life hacks to make your life happier, wealthier, and more fun.
You’ll not only learn Streamlit but also gain valuable tips and tricks to improve various aspects of your tech and data-driven life.
The course covers key topics like Streamlit, a framework for building data apps, as well as tech and data life hacks.
You’ll gain coding abilities while also picking up strategies to live a more fulfilling life in our tech-driven world.
Build a Data Science web app using Streamlit

The course starts by introducing Streamlit.
You’ll learn what Streamlit is and how to create a basic web app with it.
From there, the course dives into building a data science app locally.
You’ll learn how to train and make predictions using linear regression, a fundamental machine learning algorithm.
This hands-on project will solidify your understanding of data preprocessing, model training, and prediction.
The real magic happens when you convert your local app into a web app using Streamlit.
You’ll create the app interface, add user messages and a sidebar for interactivity.
Then, you’ll integrate file uploading and data reading capabilities, allowing users to input their own datasets.
To enhance the user experience, you’ll display data descriptions and scatter plots, giving users visual insights into their data.
The course will guide you through adding methods for training and predicting with the linear regression model you built earlier.
You’ll also learn how to display the final plot, showing the data, model, and predictions all in one place.
And to make the app truly interactive, you’ll add user interaction features, allowing users to tweak parameters and see the results in real-time.
Finally, the course touches on deployment, so you can share your Streamlit app with the world.
Learn Streamlit Python from Scratch || Streamlit Bootcamp
The course starts by introducing you to Streamlit.
You’ll learn how to set up Streamlit and use its textual functions to display text, DataFrames, and code snippets.
Next, you’ll dive into adding widgets like buttons, sliders, and dropdowns to your Streamlit apps, allowing users to input data.
The course also covers displaying media files like images and videos.
You’ll then explore using data visualization libraries like Seaborn, Matplotlib, and Plotly within Streamlit to create interactive plots and charts.
The first project involves building a single-page BMI (Body Mass Index) calculator app using Streamlit.
This hands-on project will reinforce the concepts you’ve learned so far.
The capstone project is a multi-page web app that includes descriptive analytics, interactive plots, and a machine learning model for prediction.
You’ll learn how to structure a Streamlit app with multiple pages and integrate a trained machine learning model for making predictions.
Throughout the course, you’ll gain experience using Streamlit to build interactive web applications, visualize data, and deploy machine learning models.