Business analytics is the use of data to solve business problems and make better decisions.
It’s a valuable skill in today’s data-driven world, and those who master it can find careers in a wide range of fields.
By learning business analytics, you can gain the ability to analyze data, identify trends, and make data-driven recommendations.
You can use these skills to improve marketing campaigns, optimize operations, and gain a competitive edge.
Finding the right business analytics course on Coursera can be a challenge, though.
You want a program that’s comprehensive, engaging, and taught by experts.
You want to be sure it aligns with your learning style and goals.
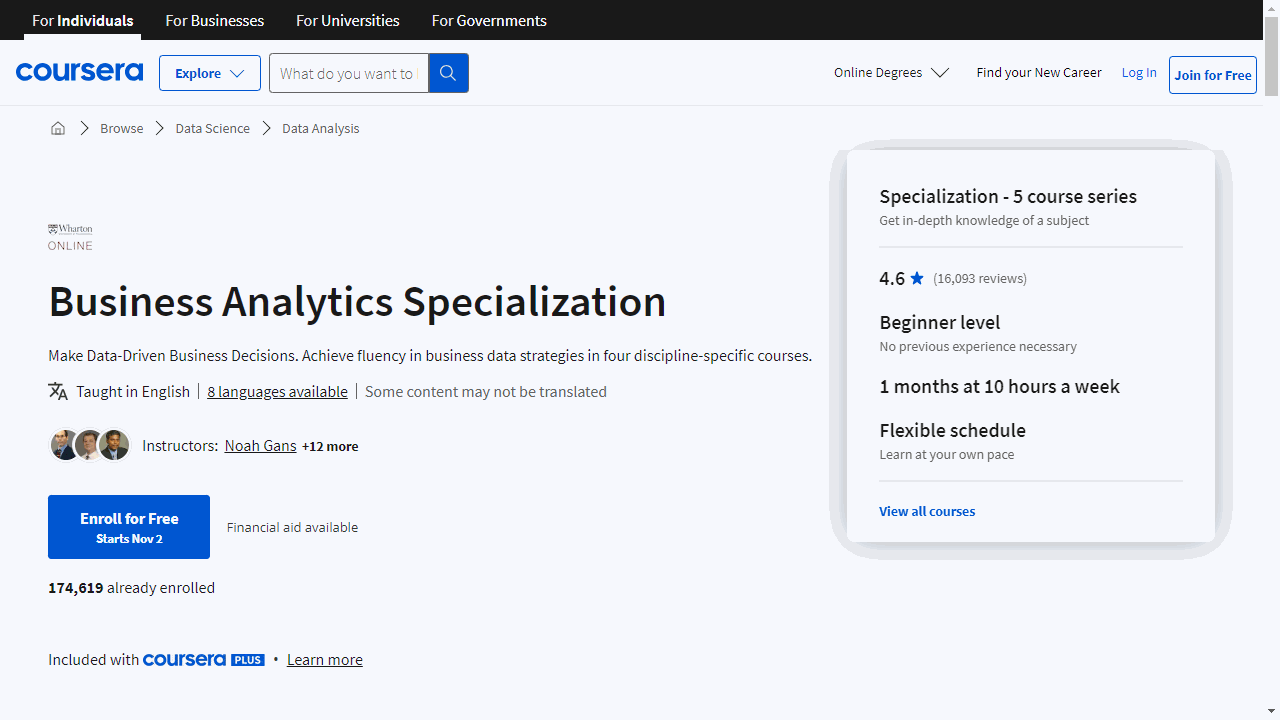
We’ve reviewed countless courses and have determined that Business Analytics Specialization by the Wharton School of the University of Pennsylvania is the best overall.
This program is a comprehensive five-course journey that equips you with the latest data analytics tools and techniques used at top companies like Yahoo, Google, and Facebook.
The courses are taught by highly-rated Wharton professors and walk you through the key aspects of business analytics step-by-step, using real-world examples to illustrate the concepts.
This makes it ideal for those looking to enter the field or those seeking to enhance their skill set.
While Business Analytics Specialization is our top pick, there are other great options available.
Keep reading to explore more recommendations and find the perfect business analytics course for your journey.
Business Analytics Specialization

This comprehensive 5-course specialization from Coursera is designed to equip you with the latest data analytics tools and techniques used at top companies like Yahoo, Google, and Facebook.
The courses walk you through the key aspects of business analytics step-by-step.
You’ll start by learning how to leverage customer data to drive profits, discover how to predict customer behavior using simulations, decision trees, and mathematical optimization.
Next, you’ll dive into operations analytics to transform data into better business decisions.
Master forecasting demand, predicting outcomes, and quantifying risk with hands-on projects.
The instructors use real-world examples to demonstrate how analytics informs strategy at successful firms.
Understanding people is critical too. The people analytics course shows you how data analysis can improve hiring, promotion, collaboration and more.
You will uncover state-of-the-art techniques used by innovative companies to recruit and retain top talent.
In addition, you’ll explore how financial statements connect to performance. Learn how accounting data provides valuable insights into consumer behavior, corporate strategy, risk management and beyond.
Finally, tie everything together in a capstone project for a global tech firm.
Devise a plan to optimize data and identify key financial indicators. You’ll be ready to make smart, data-driven decisions for any business.
With highly-rated professors from Wharton, this Coursera specialization is an essential step in your career as a business analyst.
Advanced Business Analytics Specialization
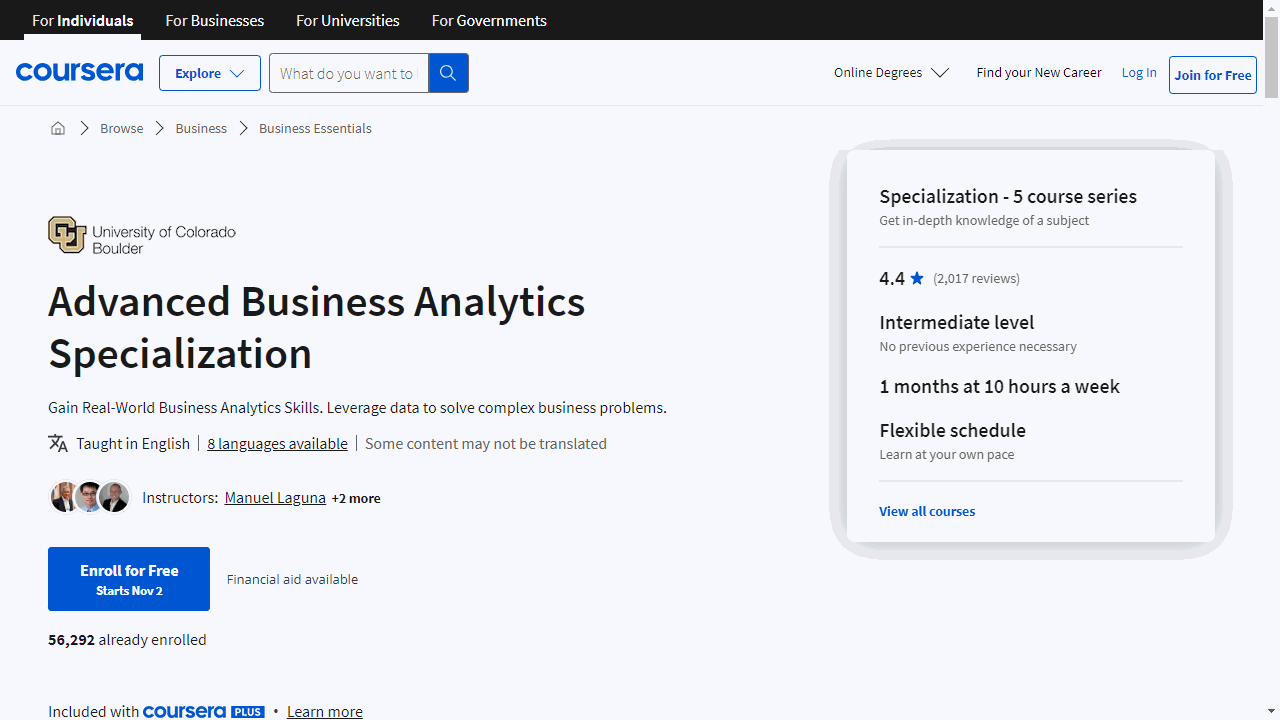
Through six courses, you’ll gain in-demand abilities to transform data into insights for smarter decision making.
The intro course gives you a strong data analytics foundation.
You’ll learn the information lifecycle, from real world to business actions. SQL skills let you extract the data you need. Relational databases will become second nature.
The predictive modeling course boosts analytical power.
Exploratory data analysis uncovers insights so you can prep data for modeling. Visualizations communicate results compellingly. XLMiner brings techniques like simulation and optimization to life.
The business analytics course focuses on decision making.
Cluster analysis segments markets. Monte Carlo simulation models uncertainty. Optimization identifies the best options among many.
No coding or advanced math needed - just Excel and the Analytic Solver Platform.
Effective communication of analytics is crucial. The dedicated course shows you how.
Tailor messaging and visuals to the audience. Stories provide context and interpretation. Convey insights clearly to non-technical stakeholders.
The capstone project ties everything together. You’ll work through a case on investing client funds.
Clean the data, build models, cluster, simulate, optimize. Finally, present actionable recommendations to clients.
Strategic Business Analytics Specialization
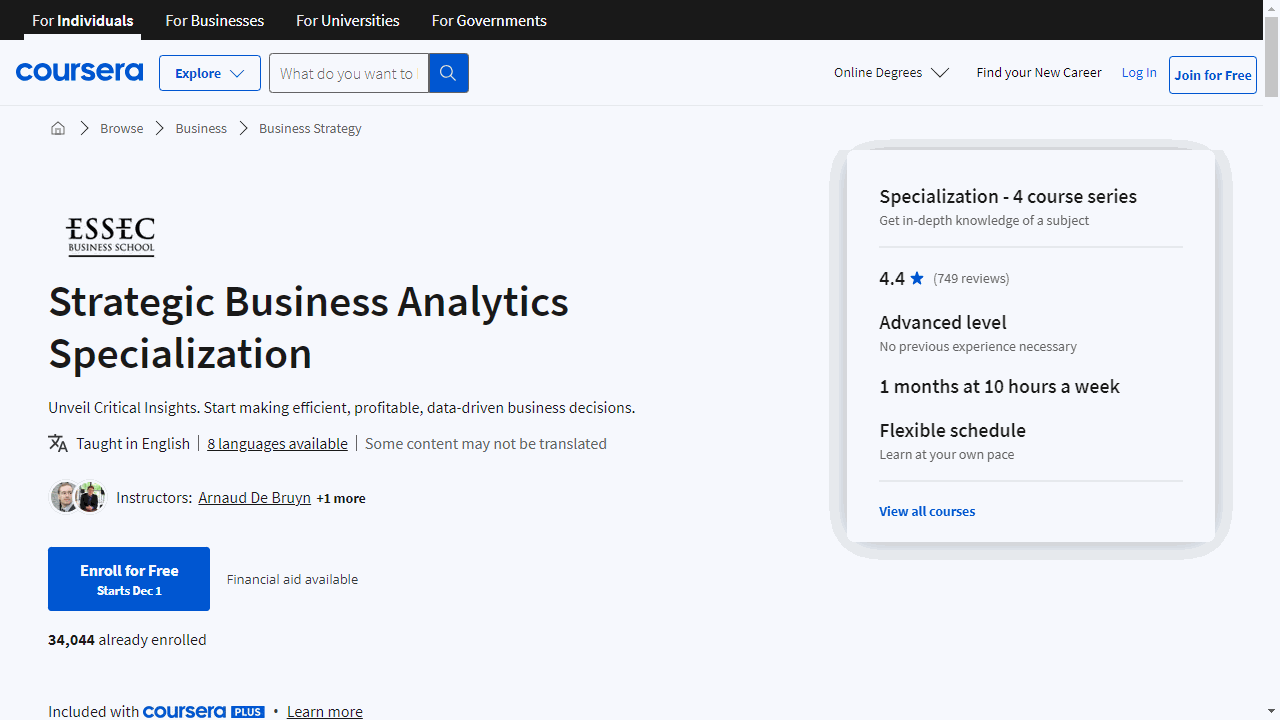
The specialization kicks off with “Foundations of Strategic Business Analytics.”
Ideal if you’re familiar with R programming and statistical concepts, this course empowers you to apply analytics across various business domains, from marketing to HR.
You’ll learn to transform data into actionable insights and master the art of communicating your findings effectively.
For those with a penchant for marketing, “Foundations of Marketing Analytics” is a gem.
It zeroes in on customer data—teaching you to segment audiences, target key customer groups, and predict their future value.
This course is about optimizing your marketing strategy to focus on the most profitable customers.
In “Case Studies in Business Analytics with ACCENTURE,” you’ll witness business analytics in action.
This course offers a glimpse into how industry experts from Accenture leverage analytics across different sectors, providing you with a broader perspective and preparing you for real-world challenges.
The capstone project, “Create Value from Open Data,” is where theory meets practice.
You’ll select a topic, analyze open data, and develop a project that addresses a real-world issue.
This hands-on experience is a chance to showcase your analytical prowess and creativity.
SAS Visual Business Analytics Professional Certificate
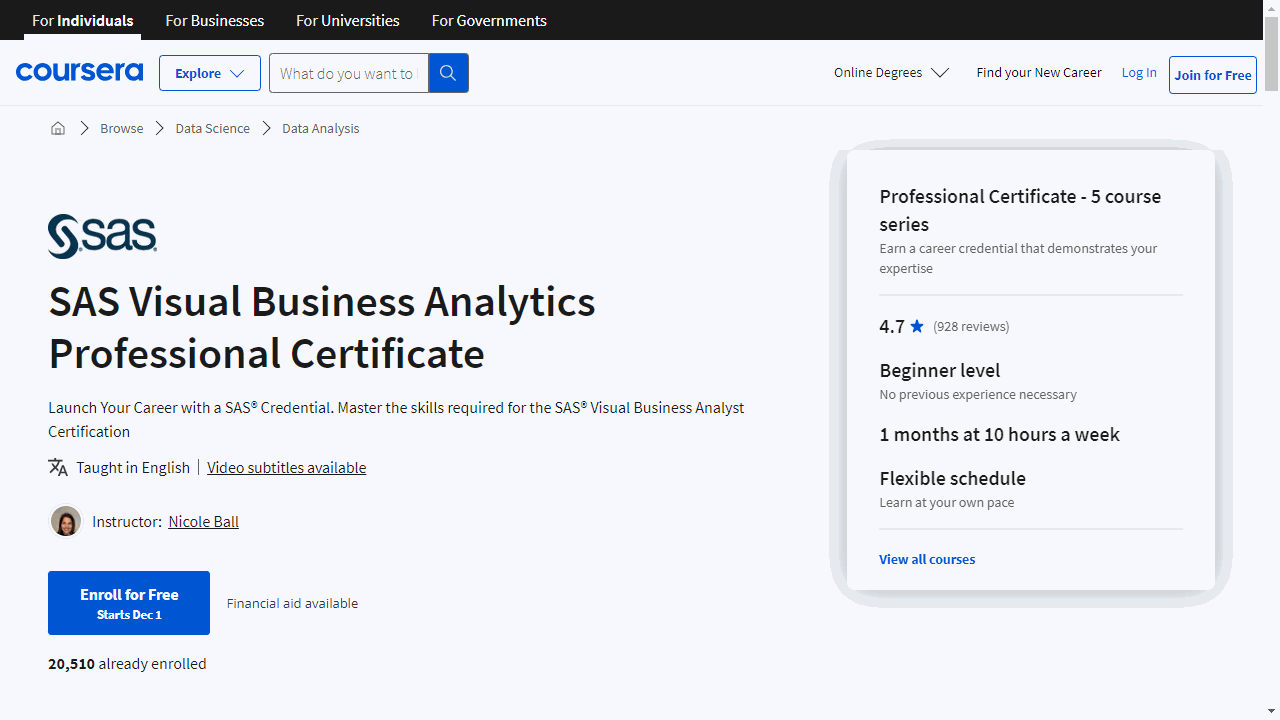
Starting with “Getting Started with SAS Visual Analytics,” you’ll unlock the potential of the SAS Viya platform.
This course equips you with the know-how to navigate, explore, and prep data for deeper analysis, setting a solid foundation for your analytics journey.
Moving on to “Data Analysis and Reporting in SAS Visual Analytics,” you’ll refine your ability to manipulate data and craft interactive reports.
It’s about transforming raw data into compelling visual stories that can inform and persuade your audience.
In “Using Data for Geographic Mapping and Forecasting in SAS Visual Analytics,” you’ll learn to structure data for spatial analysis and forecasting.
You’ll create geo maps and forecasts, gaining the skills to visualize and predict trends with geographical context.
“Performing Network, Path, and Text Analyses in SAS Visual Analytics” teaches you to uncover hidden patterns and relationships through network, path, and text analytics.
This course helps you analyze complex data structures, revealing insights that aren’t immediately apparent.
Lastly, “Creating Advanced Reports with SAS Visual Analytics” takes your reporting to the next level.
You’ll learn to build advanced data items and dynamic reports, making your analyses more interactive and adaptable to different scenarios.
University of Illinois Business Analytics Specialization
The specialization kicks off with “Introduction to Business Analytics with R,” where you’ll learn to master data processing using R and RStudio.
This course isn’t just about programming; it’s about understanding the synergy between business operations and data analytics, and how to streamline the process to make data work for you.
Moving on, “Introduction to Business Analytics: Communicating with Data” teaches you the importance of data storytelling.
You’ll learn to choose the right analytic tools and present data in a way that informs and influences business decisions. It’s about making data understandable and actionable for everyone in your organization.
In “Tools for Exploratory Data Analysis in Business,” you’ll cultivate an analytic mindset, essential for identifying and solving business problems.
You’ll get hands-on experience with PowerBI, Alteryx, and RStudio, learning to conduct exploratory data analysis that can reveal hidden opportunities and inform strategy.
For those intrigued by predictive analytics, “Machine Learning Algorithms with R in Business Analytics” offers a deep dive into the world of machine learning.
You’ll understand when and how to apply different algorithms using R, and how to interpret the results to make informed business decisions.
“Applying Data Analytics in Marketing” is tailored for those with a keen interest in marketing.
This course covers a range of analytical tools that help you understand customer behavior and satisfaction, ensuring that your marketing strategies are data-driven and effective.
Lastly, “Applying Data Analytics in Accounting” brings a technological edge to traditional accounting practices.
You’ll explore innovative topics like blockchain and process mining, and learn to apply text analysis and robotic process automation to accounting tasks using tools like R, Alteryx, and UiPath.
Introduction to Business Analytics and Information Economics Specialization
This specialization is a deep dive into the intersection of data, economics, and business strategy, equipping you with the tools to make data-driven decisions.
The “Business Analytics Executive Overview” course is your gateway to understanding analytics.
It’s not just about crunching numbers; it’s about interpreting data to make informed predictions and decisions.
You’ll explore a variety of real-world analytics problems and solutions, get acquainted with the latest technologies, and discuss future trends.
Moving on to “Infonomics I: Business Information Economics and Data Monetization,” this course challenges you to rethink the role of information in business.
You’ll learn to treat information as an economic asset, exploring its accounting, legal, and economic aspects.
The course guides you through innovative ways to monetize information, enhancing its value within your organization.
“Infonomics II: Business Information Management and Measurement” builds on these concepts, focusing on the management and valuation of information as an asset.
You’ll delve into asset management principles tailored to information, confront issues of ownership and control, and examine emerging organizational roles centered around information.
Throughout these courses, you’ll develop skills in accounting, big data, data analysis, and innovation.
You’ll emerge with a comprehensive understanding of how to manage and capitalize on information assets, positioning you to lead in the data-driven business landscape.
Excel to MySQL: Analytic Techniques for Business Specialization
This specialization is good if you want a smooth transition from Excel to SQL, while also learning other data analysis skills.
The first course, “Business Metrics for Data-Driven Companies,” introduces you to the world of data analytics and how it can make any company more competitive and profitable.
You’ll learn to distinguish critical business metrics from mere data, understand the roles of different data professionals, and even score a company on its use of big data.
Next up is “Mastering Data Analysis in Excel.”
This course focuses on data-analysis concepts and methods, using Excel for calculations. You’ll design and implement predictive models, understand the importance of uncertainty in data analysis, and learn to apply important uncertainty measures in business.
The course doesn’t cover advanced Excel functionality, but it provides enough practice to make you fluent in its most commonly used business functions.
The third course, “Data Visualization and Communication with Tableau,” teaches you how to communicate the practical implications of quantitative analyses to any audience.
You’ll learn to structure your data analysis projects, create effective visualizations in Tableau, and design persuasive business “data stories.”
“Managing Big Data with MySQL” is the fourth course in the specialization.
It introduces you to the use of relational databases in business analysis.
You’ll learn how relational databases work, how to use entity-relationship diagrams, and how to execute the most useful query and table aggregation statements.
By the end of this course, you’ll have a clear understanding of how relational databases work and a portfolio of queries to show potential employers.
The final course, “Increasing Real Estate Management Profits: Harnessing Data Analytics,” is a capstone project where you’ll use data analysis to recommend a method for improving profits for a real estate management company.
You’ll extract relevant data from a real estate database, implement data analysis in Excel, create a Tableau dashboard, and recommend a significant business process change based on your data analysis.
Business Statistics and Analysis Specialization
This is the right specialization if your motivation to learn statistics is to apply it in business cases like marketing, finance, and operations.
You’ll start with Excel training. Master functions to organize and analyze data. Create powerful pivot tables and charts to visualize insights.
Then you’ll learn key statistics concepts. Understand probability distributions like normal and binomial. Calculate percentiles, variance, correlation - everything managers look for.
Next, apply your new skills to hypothesis testing and confidence intervals. Learn to make forecasts backed by rigorous analysis. All examples are business situations you’ll encounter.
The Specialization culminates in a capstone project. You’ll work with real housing data. Mimic an analytics consultant. Showcase statistics, Excel, regression, and more.
Throughout, the focus is practical application. Courses use Excel templates you can reuse at work. Video lectures demonstrate each technique. Knowledge checks test your understanding.
You won’t just read about statistics - you will learn to use it.
Business and Financial Modeling Specialization
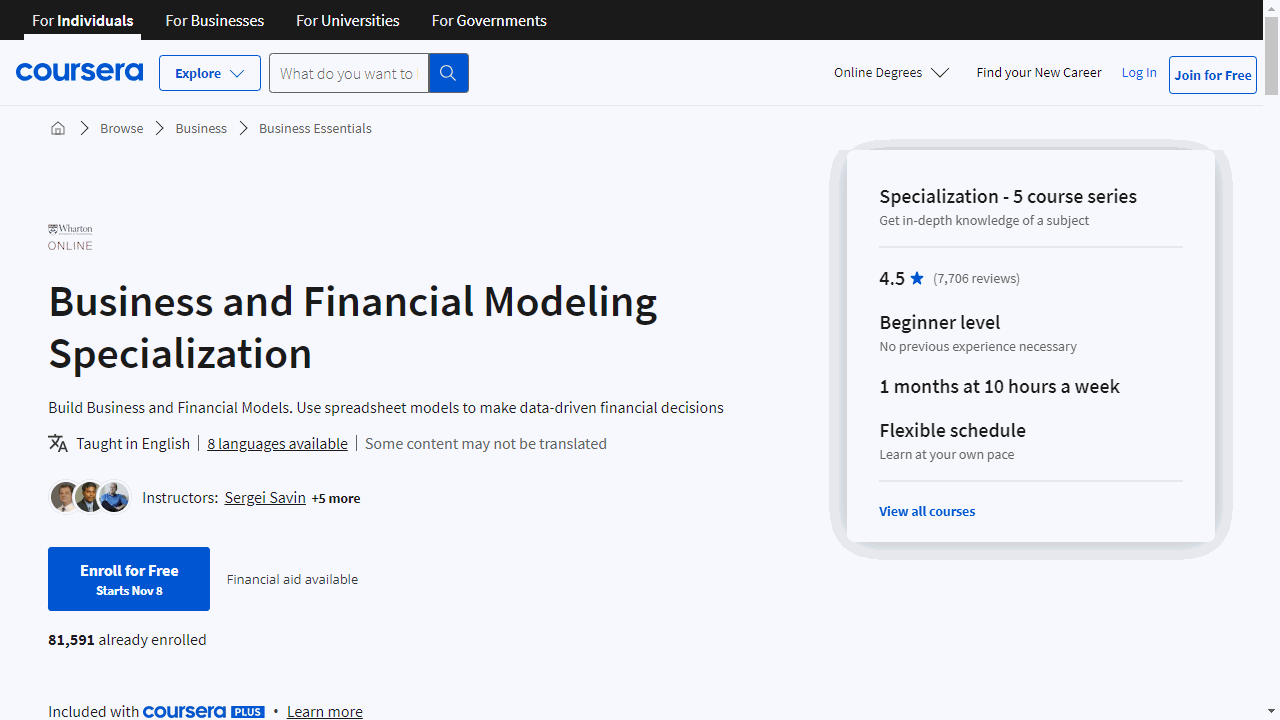
This specialization begins with “Fundamentals of Quantitative Modeling,” where you’ll grasp the essentials of using data to analyze business activities and forecast future trends.
This course lays the groundwork for creating models that can be applied to your own business challenges.
Next, “Introduction to Spreadsheets and Models” demystifies the spreadsheet, a ubiquitous tool in financial analysis.
You’ll learn practical spreadsheet functions and formulas that are crucial for organizing and projecting your business’s financial data.
In “Modeling Risk and Realities,” the focus shifts to the unpredictable nature of business.
Here, you’ll learn to build models that incorporate elements of risk and uncertainty, equipping you with the foresight to navigate complex decision-making landscapes.
“Decision-Making and Scenarios” further refines your ability to use quantitative models for business decisions.
This course teaches you to structure decision-making processes effectively, enhancing your capability to weigh alternatives and outcomes.
In the “Wharton Business and Financial Modeling Capstone,” you’ll develop a business strategy based on a data model you’ve constructed, using real-world data from Wharton Research Data Services.
This hands-on experience culminates in a professional presentation, showcasing your ability to synthesize data and analysis into actionable business insights.
Business Data Management and Communication Specialization
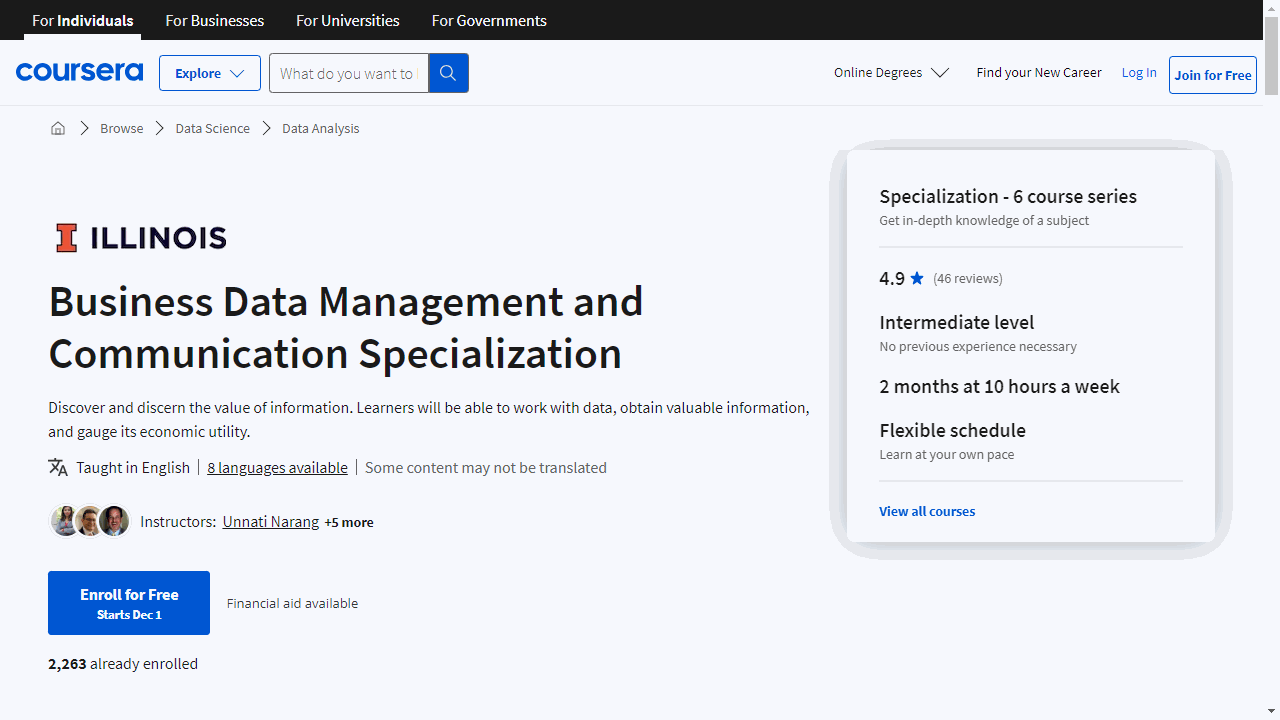
Start with “Financial Accounting: Foundations” to grasp the essentials of financial statements and accrual accounting.
You’ll learn to interpret and record financial transactions, crucial for any business professional.
This course is a component of the University of Illinois’s iMBA, ensuring you’re receiving a high-caliber education.
Next, “Financial Accounting: Advanced Topics” delves into the lifespan of assets and the intricacies of liabilities and equity.
Mastering the cash flow statement is key, and this course ensures you can analyze a company’s liquidity with confidence.
For a practical approach to data, “Introduction to Business Analytics: Communicating with Data” teaches you to select the right analytics tools and apply them to real-world business scenarios.
It’s about making data work for you in making informed decisions.
“Introduction to Business Analytics with R” is hands-on, focusing on the R programming language.
You’ll use RStudio to manage and prepare data for analysis, bridging the gap between business challenges and data solutions.
“Infonomics I: Business Information Economics and Data Monetization” redefines how you view information—as an asset that can be monetized.
This course encourages creative thinking to unlock the financial potential of data.
Finally, “Infonomics II: Business Information Management and Measurement” teaches you to manage information as an asset.
You’ll learn to measure data’s value, navigating the complexities of information ownership and leveraging data for business advantage.
Also check our posts on: