Business intelligence (BI) is the process of collecting, analyzing, and interpreting data to help businesses make better decisions.
It’s crucial in today’s data-driven world, enabling companies to optimize operations, gain a competitive edge, and understand customer behavior.
By mastering BI tools and techniques, you can unlock valuable skills applicable across various industries and roles.
Finding the right BI course on Udemy can be a challenging task with so many options.
You’re looking for a comprehensive program that’s engaging, taught by experts, and aligns with your learning style and career goals.
For the best business intelligence course overall on Udemy, we recommend Microsoft Power BI Desktop for Business Intelligence.
This course is comprehensive and covers everything from data connection and transformation to advanced data modeling and visualization using Power BI Desktop.
The instructor provides clear explanations and numerous hands-on assignments, making it an ideal choice for beginners and those looking to deepen their BI knowledge.
While this is our top pick, there are many other fantastic BI courses on Udemy.
Keep reading to explore our recommendations for different learning styles and goals, including courses focused on specific BI tools like SQL, Tableau, and Excel, as well as those catering to specific career paths within the BI field.
Microsoft Power BI Desktop for Business Intelligence
The course starts by introducing you to Power BI Desktop - what it is, how to download it, and getting familiar with its interface and workflow.
You’ll learn about the different data connectors available and how to connect to various data sources like databases and web data.
Once connected, you’ll dive into shaping and transforming data using the Power Query Editor.
This includes basic table transformations, working with text, numbers, dates, creating calculated columns, grouping, pivoting, merging queries, and refreshing data.
Plenty of hands-on assignments reinforce the concepts.
Next up is data modeling - a crucial step in BI.
You’ll learn database normalization, creating relationships between tables, handling different schemas, managing filter context, creating hierarchies, and formatting data appropriately.
More assignments help solidify these skills.
A major part of the course focuses on using DAX (Data Analysis Expressions) to create calculated fields and measures.
You’ll start with DAX basics, then move to math, statistical, text, date/time functions, logical operations, iterators, and time intelligence calculations like year-over-year or running totals.
The many examples make DAX less intimidating.
With data prepped, you’ll learn to build insightful reports and dashboards.
This includes layout design, adding visuals like charts, tables, maps, gauges, designing interactions like drill-down/up, bookmarks, and parameters.
You’ll also explore AI visuals like smart narratives and key influencers.
Finally, the course covers optimizing reports for better performance using tools like the Performance Analyzer.
It also gives you a sneak peek into publishing reports to the Power BI Service.
To apply what you’ve learned, there’s a bonus project where you’ll go through the full BI workflow for a fictional client called Maven Market.
The course wraps up by highlighting new and upcoming Power BI features.
SQL - MySQL for Data Analytics and Business Intelligence
The course starts with the fundamentals, introducing you to databases, SQL as a declarative language, and the different types of SQL statements like DDL, DML, DCL, and TCL.
The course then dives into the intricacies of MySQL, covering topics like data types, constraints, coding techniques, and best practices.
One of the standout features of this course is its practical approach.
You’ll learn by working with real-world databases like the ’employees’ database, which allows you to practice and reinforce the concepts you’ve learned.
The course covers essential SQL statements like SELECT, INSERT, UPDATE, and DELETE, along with advanced topics like aggregate functions, joins, subqueries, self-joins, views, and stored routines.
The instructor does an excellent job of explaining complex concepts in a clear and concise manner, using visuals and examples to aid understanding.
The course also covers advanced topics like MySQL indexes, triggers, window functions, common table expressions (CTEs), and temporary tables, which are invaluable for data analysts and business intelligence professionals.
Additionally, the course includes a section on combining SQL and Tableau, which is a powerful data visualization tool.
You’ll learn how to transfer data from MySQL to Tableau and create insightful visualizations and dashboards, enhancing your data analysis and presentation skills.
Throughout the course, you’ll encounter exercises and quizzes that reinforce your learning and help you practice the concepts you’ve learned.
The instructor provides detailed solutions, ensuring that you understand the material thoroughly.
One of the unique aspects of this course is its focus on writing efficient and professional SQL code.
The instructor emphasizes coding techniques and best practices, which will be invaluable as you work on real-world projects.
The Business Intelligence Analyst Course 2024
You will start by learning the fundamentals of data science, including the different disciplines like traditional data analysis, big data, business intelligence, machine learning, and artificial intelligence.
The course covers essential statistical concepts, both descriptive and inferential, giving you a solid foundation for data analysis.
Next, you will dive into relational database theory and learn SQL, a crucial skill for working with databases.
The course covers various SQL topics, such as querying data, joins, subqueries, stored routines, window functions, and more.
You will also learn how to integrate SQL with Python, a popular programming language for data analysis.
Speaking of Python, the course provides a thorough introduction to programming with Python, covering variables, data types, syntax, operators, conditional statements, functions, and iterations.
You will learn how to work with Python sequences like lists, tuples, and dictionaries, as well as advanced tools like object-oriented programming, modules, packages, and the standard library.
The course also introduces you to Tableau, a powerful data visualization tool.
You will learn how to connect data sources, create charts and dashboards, and perform advanced analysis using Tableau’s functionalities like joins, blending data, and interactive filters.
One of the highlights of the course is the integration section, where you will solve a real-world business problem by combining Python, SQL, and Tableau.
You will learn data preprocessing techniques, work with APIs and text files, and integrate data across different software platforms.
Throughout the course, you will work on practical exercises and real-world examples, ensuring that you gain hands-on experience in applying the concepts you learn.
Microsoft Excel: Business Intelligence w/ Power Query & DAX
This course teaches you how to use Excel’s powerful data modeling and business intelligence tools to connect, transform, and analyze large datasets.
It starts by introducing the “Power Excel” workflow, which involves using Power Query to connect and transform raw data sources, and then building relationships between tables in Excel’s data model.
You’ll learn how to apply basic table transformations, work with text, number, and date fields, and even create rolling calendars using custom M queries in the Excel Query Editor.
Next, you’ll dive into the principles of database normalization and learn how to structure efficient data models using table relationships instead of merged tables.
The course covers key concepts like cardinality, filter flow, and hiding fields from client tools like PivotTables.
With your data model built, you’ll learn how to analyze your data using Power Pivot and Data Analysis Expressions (DAX).
You’ll discover the differences between calculated columns and measures, and understand how to use DAX formula syntax and operators to create powerful calculated fields.
The course includes demos of key DAX functions for math, logic, text manipulation, and even time intelligence for calculating period-over-period changes or running totals.
Throughout the course, you’ll work with downloadable project files to practice your new skills.
The instructor shares best practices for Power Query, data modeling, and DAX development, and discusses topics like managing query performance and speed.
Finally, the course wraps up with an overview of data visualization options for your Excel data models, including PivotTables, Power View, and even Microsoft Power BI.
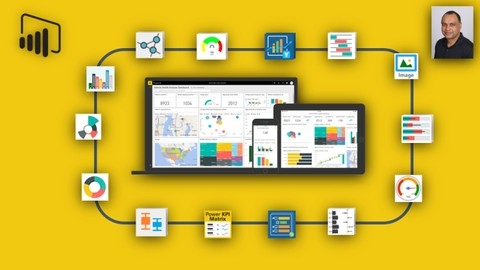
Power BI - Business Intelligence for Beginners to Advance
This course starts by introducing you to the fundamentals of business intelligence and why companies use it.
You’ll learn about Power BI, its components like Power BI Desktop and Service, and the different types of analytics.
The course then dives into collecting, ingesting, and importing data from various sources like CSV, Excel, web, SQL Server, and OData feeds.
You’ll master cleaning and shaping data using Power Query, a crucial skill for any data analyst.
The visuals section covers creating compelling charts, from bar and line graphs to treemaps and funnel charts, helping you effectively communicate insights.
Notably, the course explores AI visuals like ChatGPT and Microsoft CoPilot, keeping you ahead of the curve.
Data modeling concepts like star and snowflake schemas are explained, equipping you with the knowledge to build robust data models.
The extensive DAX (Data Analysis Expressions) section teaches you to create calculated columns and measures, enabling advanced data analysis.
With 18 real-world projects, you’ll gain hands-on experience in areas like finance, sales, HR, and IT, solidifying your learning.
The course also covers enterprise-level topics like gateways for on-premises data access, row-level security, and collaboration features for sharing and publishing reports.
Bonus lectures provide best practices, tips, and tricks, ensuring you develop and deploy Power BI solutions efficiently.
Additionally, a comprehensive searchable tutorial covers Power BI, DAX, SQL, and Power Query, serving as a valuable reference.
SQL for Data Analysis: Beginner MySQL Business Intelligence
This comprehensive course takes you on a journey to master SQL querying from the ground up.
Right from the start, you’ll dive into setting up the MySQL environment, including installing the Community Server and MySQL Workbench.
The course provides step-by-step guidance for both Mac and PC users, ensuring a smooth setup process.
Once you’re all set, you’ll create the Maven Movies database, which will serve as your playground for hands-on learning.
The course kicks off by introducing you to the fundamentals of SQL querying.
You’ll learn about the “Big 6” statements and clauses that form the backbone of SQL queries: SELECT, FROM, WHERE, GROUP BY, HAVING, and ORDER BY.
Through engaging lectures and practical assignments, you’ll master each of these concepts one by one.
As you progress, you’ll explore advanced techniques like using the CASE statement for conditional logic, pivoting data with COUNT and CASE, and working with aggregate functions.
The course also covers essential topics like normalization, cardinality, and relationship diagrams, preparing you for analyzing data across multiple tables.
Speaking of multi-table analysis, the course dedicates an entire section to SQL JOINs.
You’ll learn about different JOIN types, including INNER, LEFT, RIGHT, and FULL OUTER JOINs, and how to bridge unrelated tables using multi-condition joins.
The UNION operator is also covered, allowing you to combine results from multiple queries.
Throughout the course, you’ll work on a mid-course project and a final project, giving you the opportunity to apply your newfound SQL skills to real-world business scenarios.
These projects will solidify your understanding and prepare you for the role of a business analyst.
What sets this course apart is its laser-focus on SQL querying for data analysis, steering clear of database administration tasks.
This approach ensures that you gain a deep understanding of SQL’s analytical capabilities, which are crucial for extracting valuable insights from data.
Master Course in Tableau for Business Intelligence
The course starts with the basics, guiding you through installing Tableau and connecting to data sources, including open data from the UK government.
You’ll learn to build essential visualizations like bar charts, box and whisker plots, and maps, while mastering features like filters, tooltips, and formatting.
As you progress, the syllabus dives into intermediate concepts like time series analysis, trend forecasting, and data blending – a powerful technique for leveraging multiple data sources.
You’ll also explore calculated fields, table calculations, and how to create visuals like tree maps and stacked bars.
But the real test comes in Stage 3, where you’ll build three linked dashboards from scratch, putting all your newfound skills into practice.
This hands-on project will have you creating intricate visualizations, formatting dashboards, and implementing advanced navigation with actions and filters.
Along the way, you’ll discover handy features that streamline your workflow, such as hierarchies for organizing data fields, bins for grouping data, and pivot functionality.
Plus, you’ll learn how to create eye-catching visuals like Gantt charts, waterfall charts, and even word clouds.
For those aiming for professional certification, the course prepares you for the Tableau Qualified Associate Exam and provides tips on showcasing your skills to potential employers.
And if that’s not enough, bonus lectures cover advanced topics like custom color palettes, shapes, and Level of Detail (LOD) expressions – perfect for taking your Tableau game to the next level.
Advanced SQL: MySQL for Ecommerce & Web Analytics
You’ll start by ensuring you have the prerequisite SQL skills from the instructor’s “SQL Database for Beginners” course.
Once you’re up to speed, you’ll dive into setting up MySQL on your computer, whether you use a Mac or PC.
You’ll download MySQL Community Server and MySQL Workbench, then connect them for a seamless workflow.
The real fun begins when you analyze traffic sources for the fictional Maven Fuzzy Factory database.
You’ll find top sources, calculate conversion rates, optimize bids for paid traffic, and perform trend analyses with granular segments.
This practical approach will sharpen your SQL skills for real-world applications.
Website performance is another crucial area covered.
You’ll analyze top pages, entry pages, and bounce rates, and even test landing page variations.
Building conversion funnels and testing conversion paths will give you insights into user journeys.
Midway through, you’ll tackle a project that ties together everything you’ve learned so far.
Then, you’ll move on to channel portfolio management, analyzing seasonality and business patterns, and conducting in-depth product analyses, including sales, launches, website pathing, conversion funnels, cross-selling, and refund rates.
The course wraps up with a focus on user behavior, such as identifying repeat visitors, analyzing time between visits, channel preferences, and comparing new vs. repeat customer conversion rates.
Throughout the course, you’ll work with the Maven Fuzzy Factory database, giving you hands-on experience with real-world datasets.
The instructor provides assignments and solutions, so you can practice and reinforce your learning.
Business Intelligence with Power BI Desktop
You’ll start by learning how to connect to and shape data from various sources.
This includes transforming data, working with different data types like text, numbers, and dates, as well as grouping, aggregating, pivoting, and merging queries.
Next, you’ll dive into table relationships and data modeling concepts.
You’ll understand normalization, create relationships between tables, work with different schema types like snowflake, manage filter propagation, and learn how to hide fields from reports.
A major part of the course focuses on analyzing data using DAX (Data Analysis Expressions).
You’ll learn calculated columns, measures (implicit and explicit), and a wide range of DAX functions for dates, text, math, counting, filtering, and time intelligence calculations.
Important concepts like CALCULATE, CALCULATEALL, and iterator functions are also covered.
When it comes to data visualization, you’ll explore different chart types like matrices, maps, treemaps, and gauges.
You’ll format visuals, add filters and slicers, create trendlines and forecasts, and learn about report interactions like drill-through, bookmarks, and what-if analysis.
Other topics include data types and categories in Power BI, creating hierarchies, managing roles and mobile layouts, and connecting to folders for refreshing data sources.
Machine Learning and Business Intelligence Masterclass
You’ll start with the fundamentals of machine learning, including statistics essentials, an overview of machine learning concepts, and an introduction to Python for machine learning.
The course then dives into various machine learning techniques like supervised and unsupervised learning, sampling methods, probability distributions, hypothesis testing, and more.
A significant portion is dedicated to practical machine learning projects.
For example, you’ll learn how to estimate shipping times, analyze supply chain demand trends, predict prices using regression, detect banking and credit card fraud, and more.
These hands-on projects will give you experience applying machine learning to real-world business problems.
The course also covers important BI concepts like data warehousing, ETL (extract, transform, load) processes, metadata management, and business intelligence frameworks.
You’ll learn about tools like Amazon Machine Learning, TensorFlow, and R for implementing machine learning models.
Additionally, there are sections on emerging trends in machine learning, deep learning, natural language processing (NLP), and advanced topics like Bayesian machine learning and gradient boosting machines.
Throughout the syllabus, you’ll find practical examples, hands-on exercises, and real-world case studies to reinforce the concepts.
Also check our posts on:


