Microsoft Power BI Desktop for Business Intelligence
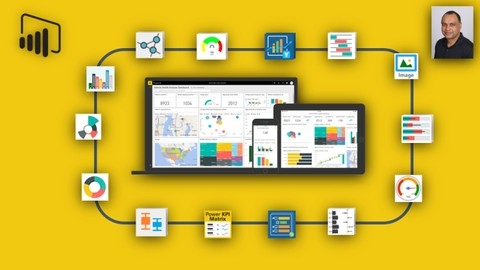
The course starts by introducing you to Power BI Desktop - what it is, how to download it, and getting familiar with its interface and workflow.
You’ll learn about the different data connectors available and how to connect to various data sources like databases and web data.
Once connected, you’ll dive into shaping and transforming data using the Power Query Editor.
This includes basic table transformations, working with text, numbers, dates, creating calculated columns, grouping, pivoting, merging queries, and refreshing data.
Plenty of hands-on assignments reinforce the concepts.
Next up is data modeling - a crucial step in BI.
You’ll learn database normalization, creating relationships between tables, handling different schemas, managing filter context, creating hierarchies, and formatting data appropriately.
More assignments help solidify these skills.
A major part of the course focuses on using DAX (Data Analysis Expressions) to create calculated fields and measures.
You’ll start with DAX basics, then move to math, statistical, text, date/time functions, logical operations, iterators, and time intelligence calculations like year-over-year or running totals.
The many examples make DAX less intimidating.
With data prepped, you’ll learn to build insightful reports and dashboards.
This includes layout design, adding visuals like charts, tables, maps, gauges, designing interactions like drill-down/up, bookmarks, and parameters.
You’ll also explore AI visuals like smart narratives and key influencers.
Finally, the course covers optimizing reports for better performance using tools like the Performance Analyzer.
It also gives you a sneak peek into publishing reports to the Power BI Service.
To apply what you’ve learned, there’s a bonus project where you’ll go through the full BI workflow for a fictional client called Maven Market.
The course wraps up by highlighting new and upcoming Power BI features.
Microsoft Power BI - The Practical Guide 2024
You’ll start by learning what Power BI is and how to install the Power BI Desktop application.
Then, you’ll dive into creating your first project, connecting to data sources like CSV files, and building your initial visuals.
This hands-on approach ensures you understand the fundamentals from the get-go.
As you progress, you’ll explore the Power BI Desktop workflow, interface, and essential settings.
The course dedicates an entire module to data preparation in the Power Query Editor, teaching you how to connect to different data sources, perform row and column operations, and handle data types.
But that’s just the beginning.
You’ll also learn about data transformation, creating data models using the star schema, and working with relationships.
The course covers the powerful DAX (Data Analysis Expressions) language, enabling you to analyze data effectively.
Once you’ve mastered the data side, you’ll move on to creating visuals in the Report View.
You’ll learn about different chart types, interactions, hierarchies, drill-down, and conditional formatting, giving you the tools to create stunning and insightful reports.
It also covers Power BI Pro and mobile features, allowing you to share and collaborate on projects using workspaces and apps.
You’ll learn how to publish data, create dashboards, and even configure gateways for scheduled refreshes.
Additionally, the course explores other data sources like JSON, REST APIs, and MySQL databases, ensuring you’re prepared to work with a variety of data formats.
Throughout the course, you’ll work on a real-world project, applying the concepts you learn to a practical scenario.
This hands-on approach solidifies your understanding and prepares you for real-world data analysis challenges.
Complete Introduction to Microsoft Power BI
This course provides a comprehensive introduction to Power BI, covering everything from signing up and getting started to creating interactive dashboards and reports.
You’ll begin by learning how to sign up for the Power BI service and download the Power BI Desktop application.
The course then dives into the Power BI Desktop interface, teaching you how to create tables, format them, and change aggregation methods like sum, average, and count.
As you progress, you’ll explore various visualization types such as clustered column graphs, stacked bar charts, line graphs for trend analysis, area graphs, and even specialized visualizations like ribbon graphs and scatter plots.
These visuals will help you effectively communicate your data insights.
The course also covers advanced topics like creating calculated columns and measures using DAX formulas, similar to Excel formulas.
You’ll learn how to establish relationships between tables and use the Power BI Query Editor to transform and aggregate data.
One of the highlights is learning to build interactive dashboards by pinning visualizations from reports.
You’ll also discover how to publish your work to the Power BI service, making it accessible on the web and mobile devices.
Towards the end, the course includes a case study on analyzing COVID-19 data using Power BI, demonstrating its real-world application.
You’ll learn how to connect to data sources, create visuals, and share insights through a dashboard.
Throughout the course, you’ll have opportunities to practice with hands-on activities and challenges, reinforcing your understanding of the concepts.
Power BI A-Z: Hands-On Power BI Training For Data Science!
The course kicks off by welcoming you with an installation guide and dataset resources.
You’ll then dive straight into creating your first bar chart in Power BI, learning how to connect to data files like CSV, navigate the interface, drill down hierarchies, add colors, calculated columns, labels, and formatting.
Next, you’ll explore time series data, understanding aggregation and granularity.
You’ll create an area chart, learn about highlighting, and work with filters and slicers.
This hands-on approach ensures you grasp these core concepts thoroughly.
Moving on, you’ll join datasets using different join types (LEFT, RIGHT, INNER, OUTER) and handle duplicate values or multiple join fields.
You’ll then create maps, leveraging hierarchies, latitudes, and longitudes, and learn the difference between calculated columns and measures through examples.
The course also covers creating scatter plots, combining charts, filters, and slicers for interactive reports.
You’ll even add a donut chart to enhance your visualizations.
In the next section, you’ll build an interactive Business Intelligence report from scratch.
You’ll map geographical roles, create table calculations for gender, and bin distributions for age and balance.
Additionally, you’ll learn to create a treemap chart and a customer segmentation dashboard, controlling report interactivity.
To take your skills further, you’ll leverage custom visuals like chord charts to visualize the European Debt Crisis.
Kirill will guide you through installing custom visuals, understanding chord chart mechanics, setting up multiple views, and adding treemaps for deeper insights.
Throughout the course, quizzes reinforce your learning, ensuring you grasp each concept before progressing.
PL-300 certification: Microsoft Power BI Data Analyst
The course starts with an introduction to Power BI Desktop, covering how to import data, create visualizations, and format reports.
You’ll learn about different chart types like bar charts, line charts, and scatter plots, as well as advanced features like bookmarks, buttons, and drillthrough.
Next, it dives deep into the Power Query Editor, teaching you how to get and transform data from various sources.
You’ll learn techniques like merging queries, unpivoting data, working with text and dates, and using M functions for complex transformations.
A major portion is dedicated to data modeling and DAX (Data Analysis Expressions).
You’ll learn how to create relationships, define calculated columns/measures, and use a wide range of DAX functions for calculations, filters, time intelligence, and more.
The course covers important modeling concepts like star schemas and role-playing dimensions.
The Power BI Service is extensively covered, including how to publish reports, share dashboards, implement row-level security, configure data refreshes, and manage workspaces.
You’ll also learn about features like Q&A, alerts, metrics, and apps.
Throughout the course, you’ll work on numerous hands-on practice activities to reinforce the concepts.
The practice files and solutions are provided.
Additionally, there are quizzes and practice tests to assess your learning.
The course is very comprehensive, covering all the major topics required for the PL-300 exam.
The instructor explains concepts clearly, using simple language and real-world examples.
The course flows naturally, taking you through a logical journey from basic to advanced topics.
However, it’s important to note that while the course prepares you thoroughly for the exam, hands-on experience with Power BI is crucial to become proficient.
The course alone may not be sufficient if you’re completely new to Power BI.
Power BI Masterclass from Scratch in 90 minutes [2024]
The course starts with an introduction to Power BI, guiding you through setting up the tool on your PC.
You’ll quickly dive into creating your first chart and visualization, making the learning process engaging from the get-go.
Next, you’ll learn how to transform and visualize data like a pro.
The course teaches you how to add columns, split columns, and perform calculations.
You’ll master page and chart formatting, creating dual-axis charts, scatter charts, and even visualizing data on maps.
Additionally, you’ll learn about hierarchies, filters (including advanced filters), and manual data entry.
The course also covers merging data from different sources, binning and grouping, adding charts from the marketplace, and exploring new features like Key Influencers and Tree Decomposition.
You’ll even learn how to perform “What If” analysis to see how changes impact your sales and profits.
Moving on, you’ll dive into Power BI’s online services, learning how to publish reports to the web, create personal gateways, schedule report refreshes, and build dashboards.
The course also covers using Power BI on mobile devices and leveraging Quick Insights to visualize data through simple questions.
To solidify your learning, you’ll create a comprehensive report incorporating all the techniques you’ve learned.
The course also includes exercises to practice your newfound skills.
Additionally, the syllabus covers connecting Power BI to SQL databases and even extracting data from PDFs.
As a bonus, you’ll receive extra content to further enhance your Power BI knowledge.
Power BI - Business Intelligence for Beginners to Advance
This course starts by introducing you to the fundamentals of business intelligence and why companies use it.
You’ll learn about Power BI, its components like Power BI Desktop and Service, and the different types of analytics.
The course then dives into collecting, ingesting, and importing data from various sources like CSV, Excel, web, SQL Server, and OData feeds.
You’ll master cleaning and shaping data using Power Query, a crucial skill for any data analyst.
The visuals section covers creating compelling charts, from bar and line graphs to treemaps and funnel charts, helping you effectively communicate insights.
Notably, the course explores AI visuals like ChatGPT and Microsoft CoPilot, keeping you ahead of the curve.
Data modeling concepts like star and snowflake schemas are explained, equipping you with the knowledge to build robust data models.
The extensive DAX (Data Analysis Expressions) section teaches you to create calculated columns and measures, enabling advanced data analysis.
With 18 real-world projects, you’ll gain hands-on experience in areas like finance, sales, HR, and IT, solidifying your learning.
The course also covers enterprise-level topics like gateways for on-premises data access, row-level security, and collaboration features for sharing and publishing reports.
Bonus lectures provide best practices, tips, and tricks, ensuring you develop and deploy Power BI solutions efficiently.
Additionally, a comprehensive searchable tutorial covers Power BI, DAX, SQL, and Power Query, serving as a valuable reference.
15 days of Power BI - Complete Microsoft Power BI Bootcamp
You’ll start by learning what Power BI is and how to navigate its interface.
The course covers essential skills like getting data, working with the Query Editor, editing rows and columns, and changing data types.
You’ll also learn how to replace values and handle data types using locales.
As you progress, you’ll dive into data preparation techniques such as extracting values, splitting columns, and performing text and numerical operations.
The course teaches you how to create data models and establish relationships between tables, a crucial step in building effective reports.
Visualization is a key aspect of Power BI, and you’ll learn how to create various chart types, including stacked column charts, pie charts, and line charts.
You’ll also explore formatting options and best practices for data visualization.
It covers advanced topics like data transformations, interactive visualizations, and advanced dashboard enhancements.
You’ll learn how to create custom columns, enable and disable data loading, handle references and duplicates, and work with conditional columns.
One of the standout features of this course is its focus on DAX (Data Analysis Expressions).
You’ll learn how to create calculated columns, measures, and use functions like AVERAGE, COUNT, DISTINCTCOUNT, SUMX, and AVERAGEX.
The course also covers filtering with DAX, using CALCULATE, FILTER, and other operators.
Time intelligence is an essential aspect of data analysis, and you’ll learn how to use functions like DATEADD and FORMAT to handle date and time data.
The course even includes a section on using ChatGPT for DAX in Power BI, demonstrating its practical applications.
Moving beyond Power BI Desktop, you’ll learn about publishing reports, the Power BI Service, scheduling refreshes, and using the Data Gateway.
The course also covers row-level and page-level security, ensuring you understand how to protect sensitive data.
If you’re interested in integrating Python with Power BI, this course has you covered.
You’ll learn how to set up Python, transform data using Python scripts, create visualizations, and even explore machine learning techniques like BayesTextAnalyzer.
Finally, the course delves into the M language, which is the underlying language used in Power BI for data transformations.
You’ll learn about values, lists, table functions, and how to transform columns using M.
Advanced DAX for Microsoft Power BI Desktop
This course starts with a review of prerequisite skills like data modeling and basic DAX.
You’ll then dive into the inner workings of the DAX engines, learning about formula and storage engines, data types, and the VertiPaq columnar data structure.
The course provides tips and best practices for writing efficient DAX code, including shortcuts, formatting guidelines, evaluation order, error handling, and using variables for testing and debugging.
You’ll explore scalar functions for aggregations, rounding, conversions, and logical operations through hands-on assignments.
Advanced CALCULATE is a major focus, covering expanded tables, context transition, evaluation order, and modifiers like REMOVEFILTERS and KEEPFILTERS.
Table and filter functions like DISTINCT, VALUES, ALLEXCEPT, ALLSELECTED, and SUMMARIZE are covered in depth, along with techniques for generating new data tables.
You’ll learn how to perform calculated table joins using CROSSJOIN, UNION, EXCEPT, and INTERSECT.
The course dives into relationship functions like RELATED, RELATEDTABLE, USERELATIONSHIPS, CROSSFILTER, and TREATAS for working with virtual relationships.
Iterator functions are explored, including CONCATENATEX for dynamic labeling, AVERAGEX for moving averages, and RANKX.
Time intelligence is another key topic, covering automatic date tables, date formatting, and functions like PARALLELPERIOD, PREVIOUSQUARTER, and SAMEPERIODLASTYEAR for period-over-period analysis.
The course provides a sneak peek into performance tuning with the Power BI Performance Analyzer and DAX Studio tools.
You’ll learn an optimization workflow to identify and address bottlenecks in your DAX code.
Throughout the course, you’ll work on a real-world project with the Maven Roasters dataset, applying the concepts through practical assignments and quizzes.
PL-900: Microsoft Power Platform Fundamentals
You’ll start by learning how to create visualizations in Power BI Desktop using various data sources like Excel.
The course teaches you to work with different visualization types, apply filters, and use AI Insights to identify data trends.
You’ll also learn data management techniques like cleaning, transforming, and combining data sources using the Power Query Editor.
Moving to the Power BI Service, you’ll publish reports and dashboards, understand workspaces and apps, and explore options for sharing and viewing content.
The course compares the desktop and online versions, highlighting their differences.
In addition to Power BI, you’ll dive into other Power Platform components.
You’ll build canvas and model-driven apps in Power Apps, connecting to data sources and customizing the user experience.
The course covers the Microsoft Dataverse (formerly Common Data Service), including tables, relationships, business rules, and real-time workflows.
Power Automate is another key topic, where you’ll create flows using connectors, triggers, actions, conditions, and loops.
You’ll automate processes across Microsoft Teams, Outlook, SharePoint, and other applications.
The syllabus also introduces Power Pages for building portals, Power Virtual Agents for creating chatbots, and AI Builder for leveraging AI models.
You’ll learn about security, governance, data loss prevention, and integrations with Dynamics 365, Microsoft 365, and Azure.
At the end, you will be well-prepared for the PL-900 certification exam, covering all the key concepts and skills required to pass.






![Power BI Masterclass from Scratch in 90 minutes [2024]](/img/best-power-bi-courses-udemy/2356870_PowerBIMasterclassfromScratchin90minutes2024.jpg)
