
Are you looking to tackle a multiclass classification problem using Python and stumbled upon CatBoost?
Or perhaps you’ve heard about CatBoost’s impressive handling of categorical data and now you’re curious to see it in action with multiclass classification.
Either way, you’ve come to the right place!
In this tutorial, we’re going to explore how to use CatBoost, a powerful machine learning library, to conquer multiclass classification problems.
I’ll start by giving you a quick primer on CatBoost and why it’s an excellent choice for multiclass classification.
Then, I’ll guide you through a hands-on example.
We’ll prepare our data, train a CatBoost model, and evaluate its performance using Python.
By the end of this tutorial, you’ll have a solid understanding of how to use CatBoost for multiclass classification, and you’ll be ready to apply what you’ve learned to your own projects.
Let’s dive in!
Why Use CatBoost For Multiclass Classification?
CatBoost is a high-performance, gradient boosting library developed by Yandex.
As the name suggests, CatBoost is particularly good at dealing with categorical data.
Unlike many other machine learning algorithms, it doesn’t require you to manually convert categorical features into numerical values before training a model.
Instead, it can handle categorical features automatically.
This makes it a lot easier to use and reduces the risk of making mistakes in this conversion process.
Multiclass Classification Quick Recap
In machine learning, classification is a task where we teach our model to predict which class or category some piece of data belongs to.
When we have more than two classes, we call it multiclass classification.
For example, if we’re trying to predict whether a wine is red, white, or rosé, that’s a multiclass classification problem because there are three possible classes.
In this tutorial, I’ll show you how to use CatBoost to solve a multiclass classification problem using the Red Wine Dataset from the UCI Machine Learning Repository.
This dataset contains various physicochemical properties of red wines, such as acidity, sugar level, and alcohol content, along with a quality rating from 3 to 8.
Our task will be to predict the quality rating, modeling each quality level as a separate class.
This task could be treated as a regression problem too, but we’ll stick to classification for this tutorial.
The loss function implemented in CatBoost for multiclass classification is the log loss (or cross-entropy loss), evaluated over a softmax of the model’s predictions or a one-vs-all approach.
How To Install CatBoost
Installing CatBoost is a straightforward process. You can use either pip or conda, two popular package managers for Python.
If you prefer to use pip, you can install CatBoost by running the following command in your terminal:
pip install catboost
Alternatively, if you’re using the Anaconda distribution of Python, you can use the conda package manager to install CatBoost.
Here’s the command you’d use:
conda install -c conda-forge catboost
In both cases, the command should download and install the CatBoost library, making it available for you to import in your Python scripts.
Preparing the Data
To start, we need to prepare our data.
This involves splitting the dataset into two parts: a training set and a test set.
We’ll use the training set to train our CatBoost model, and the test set to evaluate its performance.
First, let’s load the Red Wine Dataset using Pandas. This library makes it easy to manipulate and analyze data in Python.
To load the data, we’ll use the read_csv function from Pandas, passing the URL of the dataset as a parameter.
import pandas as pd

url = "https://archive.ics.uci.edu/ml/machine-learning-databases/wine-quality/winequality-red.csv"
data = pd.read_csv(url, sep=";")
Now, let’s split the data into features and labels.
The features are the inputs to our model (the physicochemical properties of the wines), and the labels are what we want to predict (the quality ratings).
We’ll use the drop function from Pandas to remove the ‘quality’ column from the data and store the result in a new variable called X. This data will be our features.
The labels will be the ‘quality’ column, which we’ll store in a variable called y.
X = data.drop('quality', axis=1)
y = data['quality']
Finally, we can split our data into a training set and a test set.
We’ll use the train_test_split function from the sklearn.model_selection module to do this.
This function shuffles the data and then splits it into two sets.
We’ll use 80% of the data for training and 20% for testing.
from sklearn.model_selection import train_test_split

X_train, X_test, y_train, y_test = train_test_split(X, y, test_size=0.2, random_state=42)
Now we have our training and testing data ready to go!
Next, we’ll move on to training our CatBoost model.
Training the CatBoost Model
Training a CatBoost model involves three main steps: setting the hyperparameters, identifying the categorical variables, and fitting the model to the data.
Let’s start with the hyperparameters.
These are settings that we choose before training the model.
They control things like how quickly the model learns, how complex the model can get, and how the model handles categorical variables.
In CatBoost, we set the hyperparameters by creating a CatBoostClassifier object and passing our settings as parameters.
For this tutorial, we’ll use the following settings:
-
iterations: This is the number of training iterations. More iterations can make the model more accurate, but also take longer to train. We’ll use 500 iterations. -
learning_rate: This controls how quickly the model learns. A higher learning rate makes the model learn faster, but can also make it less accurate. We’ll use a learning rate of 0.1. -
depth: This is the maximum depth of the decision trees in the model. A higher depth can make the model more complex and accurate, but also take longer to train and overfit. We’ll use a depth of 5.
from catboost import CatBoostClassifier

model = CatBoostClassifier(
    iterations=500,
    learning_rate=0.1,
    depth=5
)
Next, we need to encode the categorical variables.
However, our dataset doesn’t contain it, so we can skip this step.
If your dataset does contain categorical variables, you’ll need to create a list with the names of the corresponding columns and pass it to the cat_features parameter when creating the CatBoostClassifier object.
model = CatBoostClassifier(
    iterations=500,
    learning_rate=0.1,
    depth=5,
    cat_features=['cat_feature1', 'cat_feature2']
)
Finally, we can fit the model to our training data.
We do this by calling the fit method on our model and passing our training features (X_train) and labels (y_train).
model.fit(X_train, y_train)
That’s it!
We’ve now trained our CatBoost model.
In the next section, we’ll see how well it performs on the test data.
Evaluating the Model
After training our CatBoost model, it’s time to evaluate its performance.
We’ll do this by making predictions on the test data and then calculating some relevant metrics.
The first step is to make predictions.
We can do this by calling the predict method on our model and passing our test features (X_test). This will return a list of predicted labels.
y_pred = model.predict(X_test)
Now, we have two lists of labels: the predicted labels (y_pred) and the true labels (y_test).
We can compare these to see how well our model is doing.
There are many metrics we could use to evaluate our model, but for multiclass classification, a common choice is the F1 score.
This is a harmonic mean of precision and recall, which are two metrics that measure how well our model is doing at predicting each class.
We can calculate it using the f1_score function from the sklearn.metrics module.
from sklearn.metrics import f1_score

f1 = f1_score(y_test, y_pred, average='macro')
print(f"F1 Score: {f1}")
Another useful scikit-learn function for multiclass classification is the classification report.
This shows the precision, recall, and F1 score for each class, as well as the average values.
from sklearn.metrics import classification_report

cr = classification_report(y_test, y_pred)
print(cr)
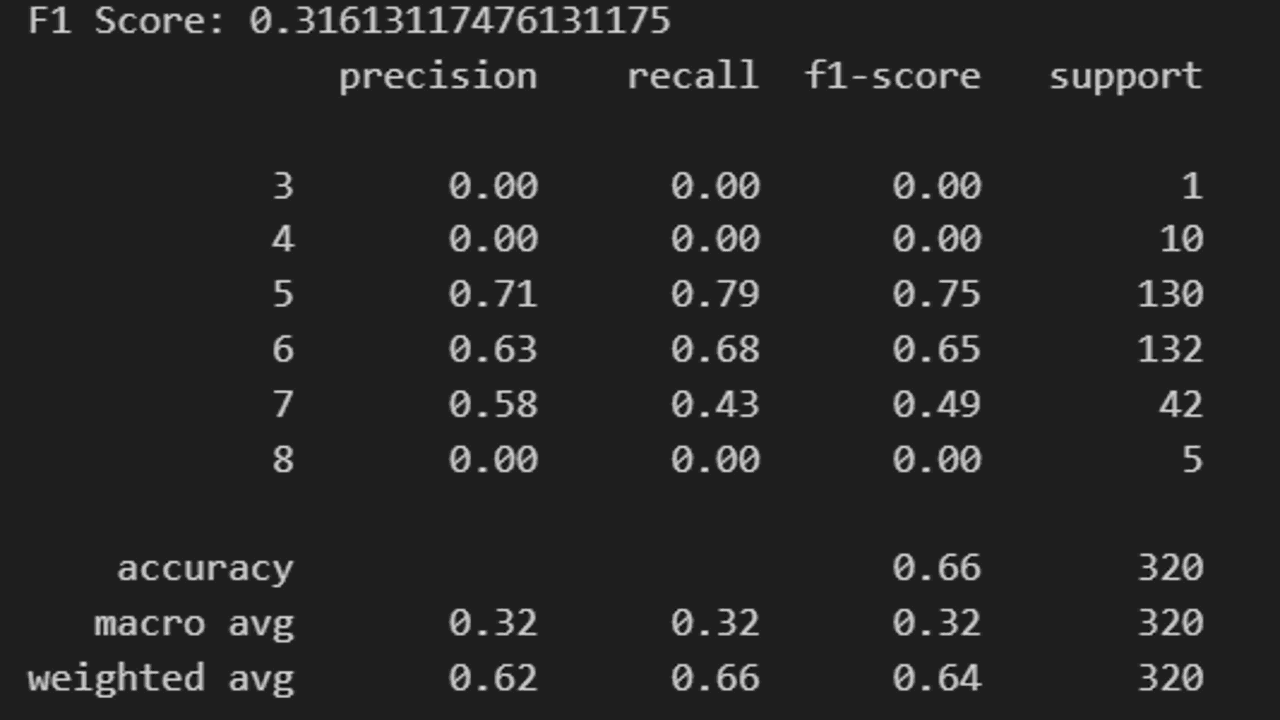
These metrics give us a good idea of how well our CatBoost model is performing.
If you want to get the predicted probabilities for each class instead of just the predicted labels, you can use the predict_proba method instead of predict.
y_pred_proba = model.predict_proba(X_test)
This function returns an array of shape (n_samples, n_classes), where n_samples is the number of samples in the test set and n_classes is the number of classes.
Each column contains the predicted probability for that class, the first class being on column zero.
Then you can use metrics like the log loss to evaluate the model.