Statistics is a vital tool for analyzing and interpreting data, making it essential for anyone working in fields like data science, business analysis, and research.
Understanding statistics empowers you to draw meaningful insights from data, make data-driven decisions, and communicate findings effectively.
It can help you uncover patterns, test hypotheses, and predict future trends, leading to better outcomes in your work.
Finding the right statistics course on Udemy can be overwhelming, with so many options available.
You’re looking for a program that’s comprehensive, engaging, and taught by experts, but also fits your learning style and goals.
For the best statistics course overall on Udemy, we recommend “Statistics for Data Science and Business Analysis” by 365 Careers.
This course offers a comprehensive journey from basic statistical concepts to advanced techniques like hypothesis testing and regression analysis.
It features clear explanations, practical examples, and real-world datasets, making it an excellent choice for both beginners and those with some prior knowledge.
While this is our top pick, there are other great options available on Udemy for different learning styles and goals.
Keep reading to explore our recommendations for beginner-friendly introductions, advanced courses focusing on specific statistical techniques, and programs tailored to particular industries or career paths.
Statistics for Data Science and Business Analysis
The course begins by laying the foundation - distinguishing between population and sample data, understanding different data types, and levels of measurement.
You’ll learn visualization techniques like frequency tables, histograms, bar charts, and scatter plots for both categorical and numerical variables.
Next, you’ll dive into measures of central tendency (mean, median, mode), asymmetry (skewness), variability (variance, standard deviation), and relationships between variables (covariance, correlation).
A practical example lets you apply these descriptive statistics concepts to real estate data.
The course then explores inferential statistics - distributions (normal, standard normal), the central limit theorem, standard error, and confidence intervals for different scenarios like known/unknown population variance, dependent/independent samples.
Another hands-on example using shoe store data reinforces these concepts.
A major portion is dedicated to hypothesis testing - forming null/alternative hypotheses, understanding errors, p-values, and testing means for various cases like known variance, unknown variance, dependent/independent samples.
You’ll practice hypothesis testing on an employee database to analyze gender pay gaps.
Regression analysis is covered extensively - correlation vs causation, linear/multiple regression models, ordinary least squares assumptions, R-squared, regression tables interpretation, and dealing with categorical data using dummy variables.
A car price prediction example ties it all together.
The course is incredibly comprehensive, taking you from basics to advanced statistical techniques through lectures, quizzes, and practical examples using real datasets.
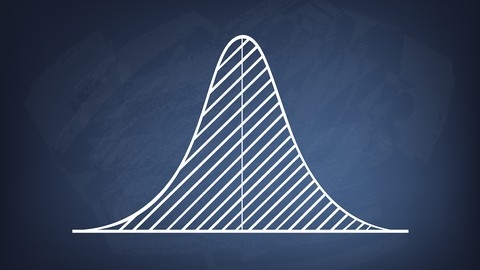
Become a Probability & Statistics Master
This course covers everything from visualizing and analyzing data to probability, sampling, hypothesis testing, and regression.
You’ll start by learning how to effectively visualize data using tools like one-way tables, bar graphs, pie charts, line graphs, ogives, two-way tables, Venn diagrams, frequency tables, dot plots, relative frequency tables, joint distributions, histograms, and stem-and-leaf plots.
Building histograms from data sets is also covered, giving you hands-on experience.
Next, you’ll dive into analyzing data, exploring measures of central tendency and spread, the impact of changing data and outliers, and how to create and interpret box-and-whisker plots.
You’ll gain a deep understanding of data distributions, learning about mean, variance, standard deviation, frequency histograms, polygons, density curves, symmetric and skewed distributions, outliers, normal distributions, z-scores, Chebyshev’s Theorem, covariance, correlation coefficients, and weighted means and grouped data.
The course then moves on to probability, covering simple probability, the addition rule, union vs. intersection, independent and dependent events, conditional probability, and Bayes’ Theorem.
You’ll learn about discrete random variables, transforming and combining them, permutations and combinations, binomial random variables, Poisson distributions, “at least” and “at most” scenarios, and Bernoulli and geometric random variables.
Sampling is a key focus, with lessons on types of studies, sampling and bias, sampling distribution of the sample mean (SDSM) and sample proportion (SDSP), conditions for inference with SDSM and SDSP, the student’s t-distribution, and confidence intervals for the mean and proportion.
You’ll become proficient in hypothesis testing, understanding inferential statistics, hypotheses, significance levels, type I and II errors, test statistics for one- and two-tailed tests, p-values, rejecting the null hypothesis, and testing population proportions.
Confidence intervals and hypothesis testing for the difference of means and proportions, as well as matched-pair hypothesis testing, are also covered.
Finally, the course delves into regression, teaching you about scatterplots, correlation coefficients, residuals, coefficients of determination, RMSE, and chi-square tests.
Throughout the course, you’ll have ample opportunity to practice and test your knowledge with quizzes and a comprehensive final exam.
By the end, you’ll have a robust toolkit for visualizing, analyzing, and interpreting data, as well as a solid grasp of probability, sampling, hypothesis testing, and regression.
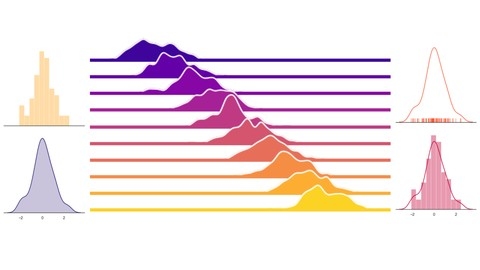
Statistics for Business Analytics and Data Science A-Z™
The course kicks off by diving into distributions, where you’ll learn the fundamentals of what a distribution is and how it’s used in data analysis.
You’ll explore the differences between continuous and discrete distributions, and gain a solid understanding of key concepts like standard deviation, normal distribution, skewness, and measures of central tendency such as mean, median, and mode.
Building on this foundation, the course then takes you on a journey through the Central Limit Theorem (CLT), a cornerstone of statistical inference.
You’ll discover the power of the CLT in action as you learn about populations, samples, and sampling distributions.
The course goes beyond just theory, providing intuitive explanations and visualizations to help you grasp the CLT’s significance.
You’ll even get hands-on with a CLT analytics challenge to cement your understanding.
With a solid grasp of distributions and the CLT, you’ll be ready to tackle hypothesis testing and statistical significance.
The course breaks down these concepts step-by-step, teaching you about p-values, the hypothesis testing process, rejection regions, and key assumptions.
You’ll learn how to conduct proportion testing and apply your skills through practical homework assignments.
But the course doesn’t stop at the basics.
It dives into advanced hypothesis testing topics like the Student’s t-distribution, t-tests, and the nuances of one-tailed and two-tailed tests.
You’ll even explore real-life examples and learn about common misuses and overuses of p-values to help you avoid pitfalls in your own analyses.
Throughout the course, you’ll have opportunities to test your knowledge with quizzes and apply your skills through hands-on exercises.
And if you ever get stuck, the course provides detailed homework solutions to help you work through challenging problems.
Probability and Statistics for Business and Data Science
The course offers a well-structured journey that starts with the fundamentals of data and gradually builds up to advanced statistical concepts.
You’ll begin by learning about different types of data, how to measure them, and key concepts like central tendency and dispersion.
Quizzes along the way will test your understanding of these foundational topics.
The course then dives into probability, covering permutations, combinations, conditional probability, and Bayes Theorem.
You’ll gain a solid grasp of these concepts through a mix of lectures and quizzes.
Next, you’ll explore various statistical distributions, including uniform, binomial, Poisson, and normal distributions.
Interactive Dash scripts in Python allow you to visualize how changes in parameters affect these distributions.
The course then moves on to inferential statistics, where you’ll learn about sampling, the Central Limit Theorem, standard error, and hypothesis testing.
Exercises will guide you through applying these concepts to real-world scenarios.
Analysis of Variance (ANOVA) is covered in detail, with lectures on one-way and two-way ANOVA, as well as the F distribution.
You’ll also learn about linear and multiple regression, enabling you to model and predict relationships between variables.
The course concludes with chi-square analysis, a valuable technique for analyzing categorical data.
Throughout the course, you’ll complete section assessments to reinforce your learning and identify areas for improvement.
Statistics for Data Analysis Using Excel 2016
Starting with the basics, you’ll learn about different types of data, measurement scales, and key terms like population and sample.
The course then dives into descriptive statistics, teaching you how to calculate and interpret measures of central tendency, variation, and shape using Excel’s built-in functions and Data Analysis Pack.
Next, you’ll explore data visualization techniques, learning how to create and interpret histograms, box and whisker plots, and scatter diagrams in Excel.
The course also covers basic probability concepts, including permutations, combinations, and the use of Excel to calculate factorials.
Moving on to probability distributions, you’ll gain an understanding of the Central Limit Theorem and learn to work with normal, binomial, and Poisson distributions using Excel.
The course then tackles hypothesis testing, explaining the different types of errors, the concept of p-value, and how to conduct one-sample and two-sample tests for means, variances, and proportions using Excel’s statistical functions.
ANOVA (Analysis of Variance) is also covered in detail, with step-by-step guidance on performing one-way and two-way ANOVA using Excel’s Data Analysis Pack.
You’ll also learn about goodness of fit tests and contingency tables, and how to implement them in Excel.
The course concludes with a thorough treatment of correlation and linear regression, teaching you how to calculate correlation coefficients, create scatter plots, and perform regression analysis using Excel’s built-in functions and Data Analysis Pack.
Throughout the course, you’ll have the opportunity to test your understanding through quizzes and hands-on exercises using real-world datasets.
When you finish, you’ll have a solid grasp of statistical concepts and be able to apply them confidently using Excel, making this course an excellent choice for anyone looking to enhance their data analysis skills.
R Programming for Statistics and Data Science
The course starts with an introduction to R and RStudio, guiding you through the installation process and familiarizing you with the user interface.
You’ll learn how to customize RStudio’s appearance and install packages, setting the stage for your R programming journey.
Next, you’ll dive into the building blocks of R, including creating objects, understanding data types (integers, doubles, characters, and logicals), and mastering coercion rules.
The course covers functions in R, teaching you how to use them and even build your own.
You’ll also learn the difference between using the script and the console.
Moving on, you’ll explore vectors and vector operations, such as indexing, slicing, and changing dimensions.
The course then delves into matrices, covering creation, indexing, slicing, arithmetic, and operations like transposition and multiplication.
The fundamentals of programming with R are thoroughly covered, including relational and logical operators, control structures (if-else, for loops, while loops), and advanced function building with scoping.
Data frames, a crucial concept in R, are introduced next.
You’ll learn how to create, import (including CSV files), export, index, slice, and extend data frames, as well as handle missing data.
Data manipulation is a key aspect, and the course utilizes the powerful Tidyverse and dplyr packages for data transformation tasks like filtering, sorting, and sampling.
You’ll also learn about tidying data with gather(), separate(), unite(), and spread().
Visualizing data is essential, and the course teaches you how to create histograms, bar charts, box plots, and scatterplots using the ggplot2 package.
Exploratory data analysis techniques are covered, including measures of central tendency (mean, median, mode), skewness, variance, standard deviation, coefficient of variability, covariance, and correlation.
The course also introduces hypothesis testing concepts like distributions, standard error, confidence intervals, types of errors, and tests for means (with known and unknown population variances).
Additionally, you’ll learn to compare means for dependent and independent samples.
Finally, the course dives into linear regression analysis, covering the regression model, correlation vs. regression, geometrical representation, interpreting regression tables, decomposition of variability (SST, SSR, SSE), and the R-squared value.
Workshop in Probability and Statistics
This course covers a wide range of highly-relevant topics, from the fundamentals of probability to advanced concepts like multiple regression and decision analysis.
You’ll start by learning the basics of probability, including events, complements, unions, and intersections.
The course then dives into measures of central tendency, variance, and standard deviation, giving you a solid foundation in descriptive statistics.
Next, you’ll explore joint and conditional probability, learning how to calculate the probability of multiple events occurring together.
Bayes’ Theorem is also covered, along with random variables and probability distributions like the binomial distribution.
The normal distribution is a key focus of the course.
You’ll learn about Z-scores, confidence intervals, and how to use the standard normal table.
Sampling and the Central Limit Theorem are also covered in depth, including proportion sampling and t-distributions.
Hypothesis testing is another important topic.
You’ll learn how to select null and alternative hypotheses and determine whether to use a one-tailed or two-tailed test.
The course then moves into regression analysis, starting with simple linear regression.
You’ll learn about scatterplots, best-fit lines, residuals, and the least-squares method.
Analyzing regression output, including R-squared, coefficients, and standard errors, is also covered.
Multiple regression is explored next, including the selection of predictor variables, multicollinearity, adjusted R-squared, and dummy variables.
You’ll also learn about transformations to linearize data for regression analysis.
Finally, the course covers decision analysis using decision trees and the value of information.
By the end, you’ll have a comprehensive understanding of probability and statistics and be able to apply these concepts to real-world problems.
Throughout the course, you’ll have opportunities to test your knowledge with comprehension checks and problem sets.
The instructor provides detailed walkthroughs of each problem set, ensuring you fully grasp the material.
Beginner Statistics for Data Analytics - Learn the Easy Way!
The course begins with the fundamentals, explaining key concepts like descriptive vs inferential statistics, population vs sample, and categorical vs numerical data.
You’ll learn different ways to visually represent data and understand the ultimate goal of statistics.
The course then dives into measures of central tendency like mean, median and mode.
Through clear explanations and examples, you’ll learn how to calculate and apply these concepts to real-world datasets.
As you progress, the material goes deeper into descriptive statistics.
You’ll learn how to create and interpret histograms, understand skewness, and calculate variance and standard deviation.
The instructor breaks down these sometimes intimidating topics in a simple, step-by-step manner.
You’ll even learn about the coefficient of variation and when it’s most useful.
In the inferential statistics section, probability distributions and the normal distribution are covered.
The central limit theorem, a key concept, is explained in a straightforward way and demonstrated with examples.
From there, you’ll learn how to calculate confidence intervals to estimate population parameters from sample data.
The last part of the course focuses on an introduction to regression analysis, an important predictive modeling technique.
You’ll learn to create and interpret scatter plots, understand correlation vs causation, and calculate correlation coefficients.
Step-by-step, you’ll see how to add a line of best fit to a scatter plot and interpret the equation of the line.
Finally, you’ll bring together everything you’ve learned to actually perform a regression analysis in Excel.
The instructor walks through how to set up your data, run the regression, and interpret the key regression statistics and outputs.
You’ll see how concepts like p-values and R-squared determine the strength of the model.
As a final step, you’ll calculate a confidence interval for your regression estimate.
With a clear and logical structure, this course guides you through both the conceptual and practical aspects of foundational statistics.
Quizzes and hands-on examples in Excel reinforce your understanding.
Master statistics & machine learning: intuition, math, code
The course begins with an introduction to the basics, including mathematical notation, arithmetic, exponents, and logarithms.
You’ll learn about different types of data, how to visualize them using graphs like histograms and violin plots, and how to summarize data using measures of central tendency and dispersion.
Next, you’ll dive into probability theory, learning about key concepts like conditional probability, the Central Limit Theorem, and Monte Carlo sampling.
This lays the foundation for the next section on hypothesis testing, where you’ll learn about p-values, confidence intervals, and the various types of statistical tests like the t-test and ANOVA.
The course then moves on to more advanced topics in statistics and machine learning.
You’ll learn about correlation and regression, including simple linear regression, multiple regression, polynomial regression, and logistic regression.
Techniques for dealing with outliers, missing data, and overfitting are also covered.
Clustering and dimension reduction techniques like K-means clustering, principal components analysis (PCA), and independent components analysis (ICA) are explored, giving you powerful tools for unsupervised learning and data visualization.
The course also delves into signal detection theory, covering concepts like d-prime, response bias, F-scores, and ROC curves.
You’ll learn how to assess the performance of statistical models and machine learning algorithms.
Throughout the course, you’ll have the opportunity to apply what you’ve learned through hands-on coding exercises in MATLAB and Python.
The instructor provides clear explanations of the code, so even if you’re new to programming, you’ll be able to follow along and gain practical skills.
By the end of this course, you’ll have a solid understanding of both the theoretical foundations and practical applications of statistics and machine learning.
Statistics for Data Analysis Using R
This course goes from the basics of R and RStudio to advanced statistical concepts and techniques.
It starts by introducing you to R and RStudio, guiding you through the installation process on Windows.
You’ll quickly dive into the fundamentals of R, learning about data types, simple mathematical operations, and saving R script files.
This hands-on approach ensures that you gain practical experience from the very beginning.
As you progress, the course delves into descriptive statistics theory, covering essential concepts like basic statistical terms, measures of central tendency (mean, median, and mode), and measures of variation (range, interquartile range, and standard deviation).
You’ll learn how to calculate these statistics using R, giving you a solid foundation in data analysis.
Next, you’ll explore different data structures in R, such as vectors, factors, lists, matrices, and data frames.
Understanding these structures is crucial for working with complex datasets and performing advanced analyses.
One of the highlights of the course is the extensive coverage of data visualization.
You’ll learn how to create various types of plots in R, including scatter plots, time series plots, histograms, and box and whisker plots.
The course teaches you how to customize your plots by adding labels, changing colors, and modifying plot characters.
You’ll even learn how to create multiple plots on a single page and add text to your visualizations.
The course also includes a bonus section on probability theory, introducing you to key concepts like probability definitions, unions, intersections, the law of addition, multiplication, conditional probability, factorials, permutations, and combinations.
This knowledge is essential for understanding probability distributions, which are covered in detail later in the course.
You’ll dive into the Central Limit Theorem and its demonstration using R. The course then focuses on three important probability distributions: normal, binomial, and Poisson.
You’ll learn the theory behind each distribution and how to work with them using R functions like rnorm, pnorm, qnorm, dnorm, rbinom, pbinom, qbinom, dbinom, rpois, ppois, qpois, and dpois.
The course also introduces the “visualize” package for visualizing these distributions.
In the inferential statistics section, you’ll learn about hypothesis testing and the different types of mean and variance tests.
The course covers one-sample and two-sample z-tests, t-tests, variance tests (chi-square and F-tests), and ANOVA (Analysis of Variance).
You’ll understand the concepts behind these tests and learn how to perform them using R and various packages like BSDA and Envstats.
The course also touches on goodness of fit tests and contingency tables, providing you with a comprehensive understanding of statistical inference.
Throughout the course, you’ll have access to detailed notes, code examples, and practice assignments to reinforce your learning.
The instructor breaks down complex concepts into easily understandable explanations, making the course accessible to learners with different backgrounds.
By the end, you’ll have a strong grasp of statistical concepts and be proficient in using R for data analysis and visualization.
Also check our posts on:
