If you’ve ever used CatBoost for machine learning, you know it’s a powerful tool.
But did you know it has several ways of calculating feature importances?
Understanding how these methods work can help you get more out of your models.
However, these methods can get a bit complex, and it’s not always clear when to use each one.
It’s like trying to choose the right tool from a toolbox when you don’t know what each tool does.
Don’t worry, though!
In this tutorial, I’ll break down each of these methods in a simple and easy-to-understand way.
We’ll go through each of the methods CatBoost offers for calculating feature importance, including PredictionValuesChange, LossFunctionChange, ShapValues, PredictionDiff, and Interaction.
Then, I’ll show you how to implement these methods in Python using a real-world dataset.
By the end of this article, you’ll have a clear understanding of how to use these tools to improve your machine learning models.
So, let’s get started!
Importance Methods Available in CatBoost
PredictionValuesChange
For each feature, PredictionValuesChange shows how much on average the prediction changes if the feature value changes.
It’s the default method for calculating feature importance in CatBoost when we’re using non-ranking metrics.
To understand how this works, let’s consider a simple example.
Imagine we’re trying to predict the price of a house based on various features like the number of rooms, location, size, and so on.
If we were to use the PredictionValuesChange method, it would calculate the average change in the predicted price if the value of a given feature was changed.
For instance, if the number of rooms in a house increases by one, how much does our predicted price change?
If this change is large, then the number of rooms is an important feature. If the change is small, then it’s not as important.
In other words, the bigger the value of the importance, the bigger on average is the change to the prediction value, if this feature is changed.
LossFunctionChange
LossFunctionChange is another method for calculating feature importance in CatBoost, and it’s the default method for ranking metrics.
While this method can be used for any model, it shines when used with ranking models.
This is because other types of feature importance might give misleading results when used with ranking models.
Let’s break down how this works:
For each feature, LossFunctionChange calculates the difference between the loss value of the model with this feature and without it.
Think of it this way: if we have a model that’s been trained with a specific feature, how much worse would our model perform if we were to remove that feature and retrain the model?
The larger the difference in performance, the more important the feature is.
Now, you might be thinking, “Wouldn’t it be computationally expensive to retrain the model for each feature?”
You’re absolutely correct!
That’s why CatBoost approximates this process.
Instead of retraining the model from scratch, it uses the original model and virtually removes the feature from all the trees in the ensemble.
It’s important to note that this calculation requires a dataset, so the calculated value is dataset-dependent.
This means that the importance of a feature might vary depending on the specific dataset used.
To put it in context, in the previous method, the importance of a feature was calculated based on the average change in the prediction value (not considering the true target), while this one goes a step further and calculates the average change in the loss value (considering the true target).
ShapValues
This is an implementation of SHAP for CatBoost.
PredictionDiff
This method is designed to analyze the impact of a feature on the prediction results for a pair of objects.
This is particularly useful for understanding why a pair of instances might be ranked incorrectly.
For each feature, PredictionDiff calculates the maximum possible change in the difference between the predictions if the value of the feature is changed for both objects.
Let’s consider our house example again, but this time, let’s say we’re trying to rank houses based on their predicted prices.
We have two houses, A and B. House A is predicted to be more expensive than house B, but in reality, it’s the other way around.
We could use PredictionDiff to understand why our model made this mistake.
For each feature (like the number of rooms, location, size, etc.), PredictionDiff would calculate how much the difference between the predicted prices for houses A and B would change if we changed the value of that feature for both houses.
However, it’s important to note that this change is only considered if it results in an improvement in the direction of changing the order of instances.
In other words, we’re only interested in changes that would make our predictions more accurate.
Interaction
Feature interaction strength measures how much two features depend on each other for making predictions.
Here’s how it works:
For each pair of features, CatBoost looks at all the splits in the trees where these features are used.
If splits of both features are present in the same tree, CatBoost calculates how much the leaf value (the final prediction) changes when these splits have the same value and when they have opposite values.
The larger the change, the stronger the interaction between the two features.
Getting Feature Importance In CatBoost In Python
In this section, we’re going to see how to get CatBoost feature importances in Python using the Red Wine Quality dataset from the UCI Machine Learning Repository.
This dataset includes various attributes of red wines, such as ‘fixed acidity’, ‘volatile acidity’, ‘citric acid’, and so on.
Our goal is to predict the quality of the wine based on these attributes.
First, we import the necessary libraries: pandas for data manipulation, CatBoost for our model, and matplotlib for plotting our feature importances later on.
import pandas as pd
from catboost import CatBoostRegressor
import matplotlib.pyplot as plt
Next, we load our dataset using pandas’ read_csv function.
df = pd.read_csv('winequality-red.csv')
Now, we need to separate our features (X) from our target variable (y).
We’re trying to predict the ‘quality’ column, so we’ll drop that column from our input dataframe and assign it to y.
The rest of the dataframe will be assigned to X.
X = df.drop('quality', axis=1)
y = df['quality']
For the sake of brevity, we’ll assume that we have already split the data into training and test sets.
Remember, feature importances are calculated using only the training set, as it’s the data used to create the model.
Next, we’ll create our CatBoost model.
We’ll use the CatBoostRegressor for this example but everything we’re doing here is also valid for CatBoostClassifier.
We’ll use the default hyperparameters.
model = CatBoostRegressor()
Then, we fit our model to the data.
model.fit(X, y)
Now comes the fun part: getting our feature importances.
CatBoost makes this easy with the get_feature_importance() method.
To make it easier to understand, let’s put everything into a pandas Series where the index is the feature name and the values are the corresponding feature importances.
importances = model.get_feature_importance(type='PredictionValuesChange')
feature_importances = pd.Series(importances, index=X.columns).sort_values()
| free sulfur dioxide | 5.52973 |
| density | 6.0906 |
| residual sugar | 6.09867 |
| fixed acidity | 6.27596 |
| pH | 6.36697 |
| citric acid | 7.5601 |
| chlorides | 8.34578 |
| total sulfur dioxide | 9.94483 |
| volatile acidity | 12.0929 |
| sulphates | 14.2125 |
| alcohol | 17.482 |
Each of the methods we discussed earlier is available as a parameter to the get_feature_importance() method. You just need to pass in the name of the method you want to use to the type parameter.
This series, feature_importances, now contains the importance of each feature in our model, according to the PredictionValuesChange method.
The higher the importance, the more influential the feature is in predicting the wine quality.
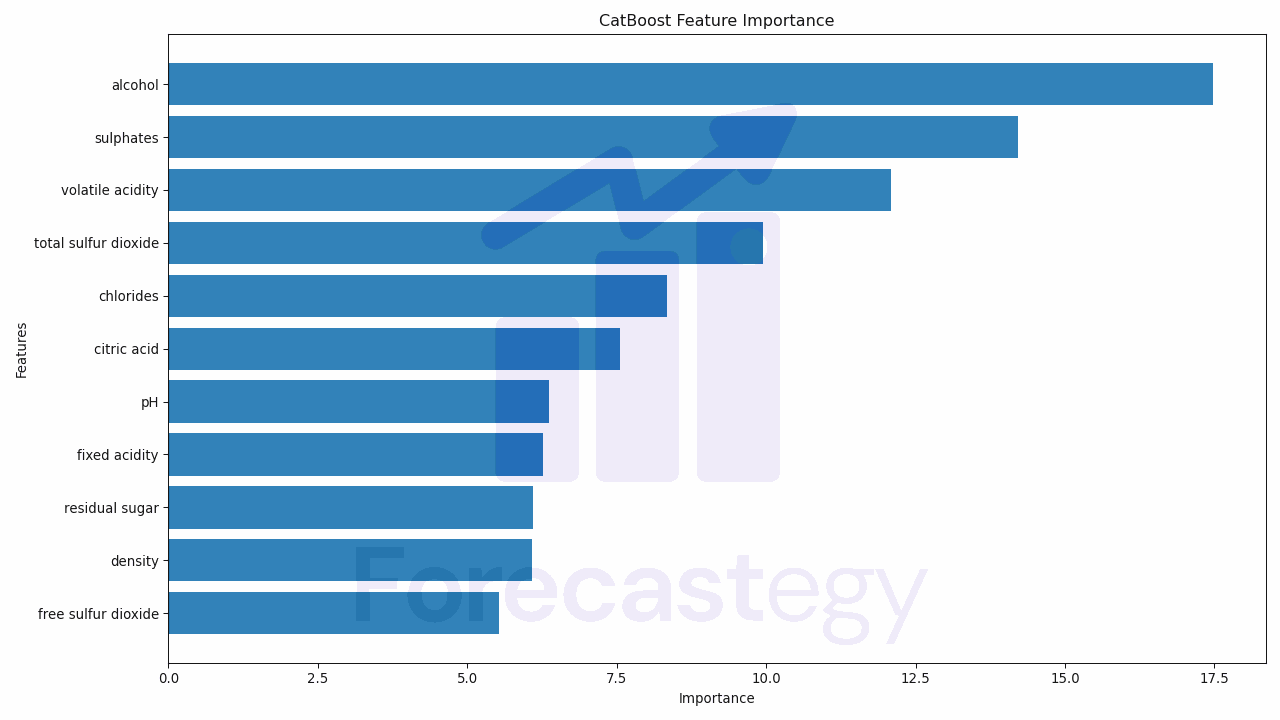
Visualizing CatBoost Feature Importance
Visualizing feature importances can help us better understand which features are most influential in our model.
We can do this by creating a bar plot with matplotlib.
In this plot, the x-axis will represent the feature importance and the y-axis will represent the feature names.
Let’s start by setting some properties for our plot.
We’ll set the figure size to make our plot larger and easier to read.
plt.figure(figsize=(10, 6))
Next, we’ll create the bar plot using the barh function from matplotlib.
We’ll pass in our feature importances as the width of our bars, and the index of our feature importances (which are our feature names) as the y-values.
plt.barh(feature_importances.index, feature_importances.values)
Then, we’ll add a title to our plot and labels to our x and y-axes to make it clear what the plot represents.
plt.title('CatBoost Feature Importance')
plt.xlabel('Importance')
plt.ylabel('Features')
Finally, we’ll use the show function to display our plot.
plt.show()

This gives us a clear visual representation of the importance of each feature in our model.
The longer the bar, the more important the feature is.
Here’s the complete code for creating the plot:
plt.figure(figsize=(10, 6))
plt.barh(feature_importances.index, feature_importances.values)
plt.title('CatBoost Feature Importance')
plt.xlabel('Importance')
plt.ylabel('Features')
plt.show()
By using this plot, you can easily see (and present) which features are most important in your model, and make decisions about feature selection, engineering, and interpretation of your model’s predictions.
Check the tutorial on how to handle categorical features in CatBoost next!